PeakTech 1211 Manual
PeakTech
Multimeter
1211
Læs nedenfor 📖 manual på dansk for PeakTech 1211 (96 sider) i kategorien Multimeter. Denne guide var nyttig for 23 personer og blev bedømt med 4.5 stjerner i gennemsnit af 2 brugere
Side 1/96
PeakTech ® 1206 1212-
User Manual
2 CH & 4 CH
Tablet Oscilloscopes

- - 1
Table of content
1. Safety precautions…............................................................................................................ 3
2. Safety symbols and terms………......................................................................................... 5
3. Quick start guide................................................................................................................... 7
3.1 Front………….……………………………………………………………………………………. 8
3.2 Side view…… ……………………………………………………………………………..……… 10
3.3 Upper side…… ………………………………………………………………………………….... 11
4. Introduction to the user interface ……………………………………………………............... 12
5. Check before commissioning………………….………………………………………………... 13
5.1 Functional test…................................................................................................................ 14
5.2 Probe compensation……………………………………………………………………………. 15
5.3 Setting the probe attenuation factor…………………………………………………………. 15
5.4 Self - calibration…………………………………………………………………………………..17
5.5 Introduction to the vertical system…………………………………………………………… 17
.......................................................................... 5.6 Introduction to the horizontal system…18
5.7 Introduction to the trigger system…………………………………………………………….19
. 5.8 Introduction to the touchscreen operation…………………………… …………………… 20
5.8.1 Change menu...................................................................................... ............…............. 20
..5.8.2 Value setting in the menu .…………………………… ……………………………………… 20
..5.8.3 Calling up the main menu .……………………………………… …………………………… 21
..5.8.4 Selection of the active channel……………………………………………………………… 21
5.8.5 Adjustment of the horizontal and vertical …………………………………………….……… 22
5.8.6 Setting the trigger level …………………………………………………………………………22
...5.8.7 Setting the time base and voltage division……………………………… ………………... 23
5.8.8 Measurements using the Cursor ………………………………………………………………23
6. User instructions (for advanced users)…………………………………….......................... ..24
.................................................................................................. 6.1 Set the vertical system .... 25
..6.1.1 Setting the channel coupling………………………………………………………………… 26
6.1.2 Setting the probe attenuation . ………………………………………………………………… 26
6.1.3 Current measurement …………………………………………………………………………. 26
6.1.4 Invert a waveform ……………………………………………………………………….……... 26
..6.1.5 Setting the bandwidth limit…………………………………………………………………… 27
6.2 Set the horizontal system….............................................................................................. 27
6.3 Waveform zoom function………………………………………………………………………. 27
6.4 Operation oft he function menu………………………………………………………… …..... 28
6.5 Set the trigger system…………………………………………………………………………... 28
6.5 28 .1Single Trigger……………………………………………………………………………………
6.5 .2 Edge Trigger……………………………………………………………………………………. 29
6.5 30 .3 Video Trigger……………………………………………………………………………………
6.5 .4 Pulse Width Trigger……………………………………………………………………………. 31
6.5.5 Slope Trigger ………………………………………………………………………………...…. 31
6.5 .6 Runt Trigger…………………………………………………………………………………….. 33
...6.5.7 Window Trigger……………………………………………………………………………… . 34
6.5 .8 Timeout Trigger………………………………………………………………………………… 35
6.5.9 Nth Edge Trigger………………………………………………………………………………..36
6.5 .10 Logic Trigger…………………………………………………………………………………...37
6.5 .11 Bus Trigger……………………………………………………………………………………. 38
7. Sampling setup………………………………………………………………...…………………... 41
8. Implementation of the function setting for the auxiliary system………………………….. 43
45 8.1 Set the display system…………………………………………………………………………..
8.1.1 Persist…………………………………………………………………………………………… 45
8.1.2 Color . 46 ……………………………………………………………………… ……………………..
8.1.3 Counter …………………………………………………………………………………….……. 46

- - 2
...................................................................................... 8.2 Save and recall a waveform…..... 47
8.2.1 Save and recall the waveform……………………………….……………………………….. 48
8.2.2 Save the current screen image…..................................................................................... 49
8.2.3 Requirements of the USB storage device…………………………………………………… 49
..8.2.4 Use system provided function to format the USB device….............. ............................. 49
8.2.5 Record and playback waveforms…................................................................................. 51
8.2.6 Clone and recall a waveform . ……………………………………………………………… ….54
8.2.7 Data format description of OTA waveform file……………………………………………….56
9. Measurement functions…….…………………………………………………………………….. 57
9.1 Measure automatically……………………………..…………………………………………... 57
9.1.1 Measure …………………………………..…………………………………………………….. 58
9.1.2 Automatic measurement of the voltage parameters……………………..……………….... 59
9.1.3 Automatic measurement of the time parameters …………………….………………......... 60
9.1.4 Other measurement functions…….………………………………………………………….. 61
9.1.5 Adjustment of the automatic measurement . ………………………………………………… 61
9.2 Measure with the cursor…..…………………………………………………………………….62
9.2.1 Cursor measurements in FFT mode………………………………………………………… 64
9.3 Mathematical manipulation function…………………………………………….……………64
9.4 User defined function……………………………………………………………………………66
9.5 Digital filter……………………………………………………………………………………….. 67
9.6 Autoscale function............................................................................................................ 67
9.7 FFT function……………………………………………………………………………………… 69
9.7.1 Select the FFT window…................................................................................................. 70
9.8 XY mode…………………………………………………………………………..……………..... 71
9.9 Pass/Fail…………………………………………………………………………………………… 71
10. Executive buttons………………………………………………………………………………... 73
10.1 Print the screen image…………………………………………………………………..……. 74
11. Using the multimeter…………………………………………………………………………….. 75
11.1 Connections of the multimeter…………………………….………………………………... 75
11.2 Menu of the multimeter………….……………………………………………………………. 75
................................................................................................ 11.3 DMM information window 77
11.4 Measurements with the multimeter………………………………………………..……….. 78
11.4.1 AC/DC voltage measurement …………………………..…………………………………… 78
11.4.2 AC/DC current measurement……………………………………………………………….. 78
11.4.3 Resistance measurement…………………………………………………………………… 78
11.4.4 Testing diodes ……………………………………...………………………………………….79
11.4.5 Capacitance measurement …...……………………………………………………………...79
11.4.6 Continuity test ……………….………………………………………………………………... 79
80 11.5 Multimeter features……………………………………………………………………………..
11.5.1 Data Hold Mod – e………..……………………………………………………………………80
11.5.2 Information display ……..…………………………………………………………………….. 80
11.5.3 Auto or manual range…………………….………………………………………………….. 80
11.5.4 Relative measurements …………………..…………………………………………………..80
11.6 Multimeter recorder......................................................................... ............................. ... 81
12. Communication with PC………………………………………………………...………………. 83
12.1 USB port…………………………………………………………………………………………. 83
12.2 LAN port…………………………………………………………………………………………. 84
13. Specification........................................................................................................................ 87
13.1 Trigger…………………………………………………………………………………………….90
13.2 Multimeter……………………………………………………………………………………….. 92
14. General specifications…………………………………………….…………………………….. 93

- - 3
1. Safety precautions
This product complies with the requirements of the following directives of the European Union for
CE conformity: 2014/30/EU (electromagnetic compatibility), 2014/35/EU (low voltage), Overvoltage
category Pollution degree II; 2.
To ensure the operational safety of the device and to avoid serious injuries from current or voltage
flashovers or short circuits, the following safety instructions for operating the device must be
observed.
Only connect the device to sockets with a grounded protective conductor
Damages caused by non-observance of these instructions are excluded from claims of any kind.
* This device must not be used in high-energy circuits.
* Before connecting the device to a socket, check that the voltage setting on the device
corresponds to the existing mains voltage
* Only connect the device to sockets with a grounded protective conductor
* Do not place the device on a damp or wet surface.
* Do not operate the device in the vicinity of strong magnetic fields (motors, transformers, etc.)
* Do not exceed the maximum permissible input values under any circumstances (risk of serious
injury and / or destruction of the device)
* The specified maximum input voltages must not be exceeded. If it cannot be ruled out
unequivocally that these voltage peaks are exceeded due to the influence of transient interference
or for other reasons, the measurement voltage must be pre-damped accordingly (10: 1).
* Before switching to another measuring function, disconnect test leads or probe from the
measuring circuit.
* Check the device, test leads and other accessories for possible damage or bare or kinked cables
and wires before commissioning. If in doubt, do not take any measurements.
* Only carry out measurements in dry clothing and preferably in rubber shoes or on an insulating
mat.
* Do not touch the measuring tips of the test leads.
* Strictly observe the warning notices on the device.
* The device should not be operated unsupervised
* Do not expose the device to extreme temperatures, direct sunlight, extreme humidity or moisture.
* Avoid strong vibration.
* Keep hot soldering guns away from the immediate vicinity of the device.
* Before starting the measuring operation, the device should be stabilized to the ambient
temperature (important when transporting from cold to warm rooms and vice versa)
* Do not exceed the set measuring range with any measurement. This will prevent damage to the
device.
* Clean the housing regularly with a damp cloth and a mild detergent. Do not use any caustic
abrasives.
* Avoid any proximity to explosive and flammable materials.
* Opening the device and maintenance and repair work may only be carried out by qualified service
technicians.
* Do not place the device face down on the workbench or work surface to avoid damaging the
controls.
* Do not make any technical changes to the device.
* -Measuring devices do not belong in the hands of children-

- - 4
Warning!
If the oscilloscope is connected to an input signal of more than 42V peak (30Veff) or to circuits with
more than 4800VA, please observe the instructions below to avoid fire or electric shock:
- Use only insulated probes and test leads.
- Check all accessories before use and replace them if damaged. If in doubt, do not take
any measurements.
- Remove the USB cable that connects the oscilloscope to the computer.
- Never exceed the maximum specified input voltages. Since the voltage is transmitted
directly to the oscilloscope with the aid of the probe, the device can be damaged or there
is a risk of injury from electric shocks.
- Do not use exposed BNC or banana plugs.
- Do not insert any metal objects into the connections.
Cleaning the device:
Before cleaning the device, pull the plug out of the socket. Only clean the device with a damp, lint-
free cloth. Use only commercially available detergents.
When cleaning, make sure that no liquid gets inside the device. This could lead to a short circuit
and the destruction of the device.
- - 5
2. Safety symbols and terms
You can find the following symbols in these operating instructions or on the measuring
device.
Warning!
„Warning” indicates conditions and operating steps that pose a risk to the operator.
Attention!
„Attention” indicates conditions and operating steps that can cause damage to the
product or other objects.
Danger: High
voltage
See user
manual
Protective
conductor
terminal
Device
grounding
Earth clamp
(Ground)
In order to avoid physical damage and damage to the measuring device and the measuring
objects, you should read the following paragraph carefully and always pay attention to it during
future use. This device may only be used for the intended areas of application.
Warning:
The channels of the oscilloscope are not electrically isolated from one another. Therefore,
the measuring channels should be on a common ground during a measurement. To avoid
short circuits, the earth terminals must not be connected to different, non-isolated DC
levels.
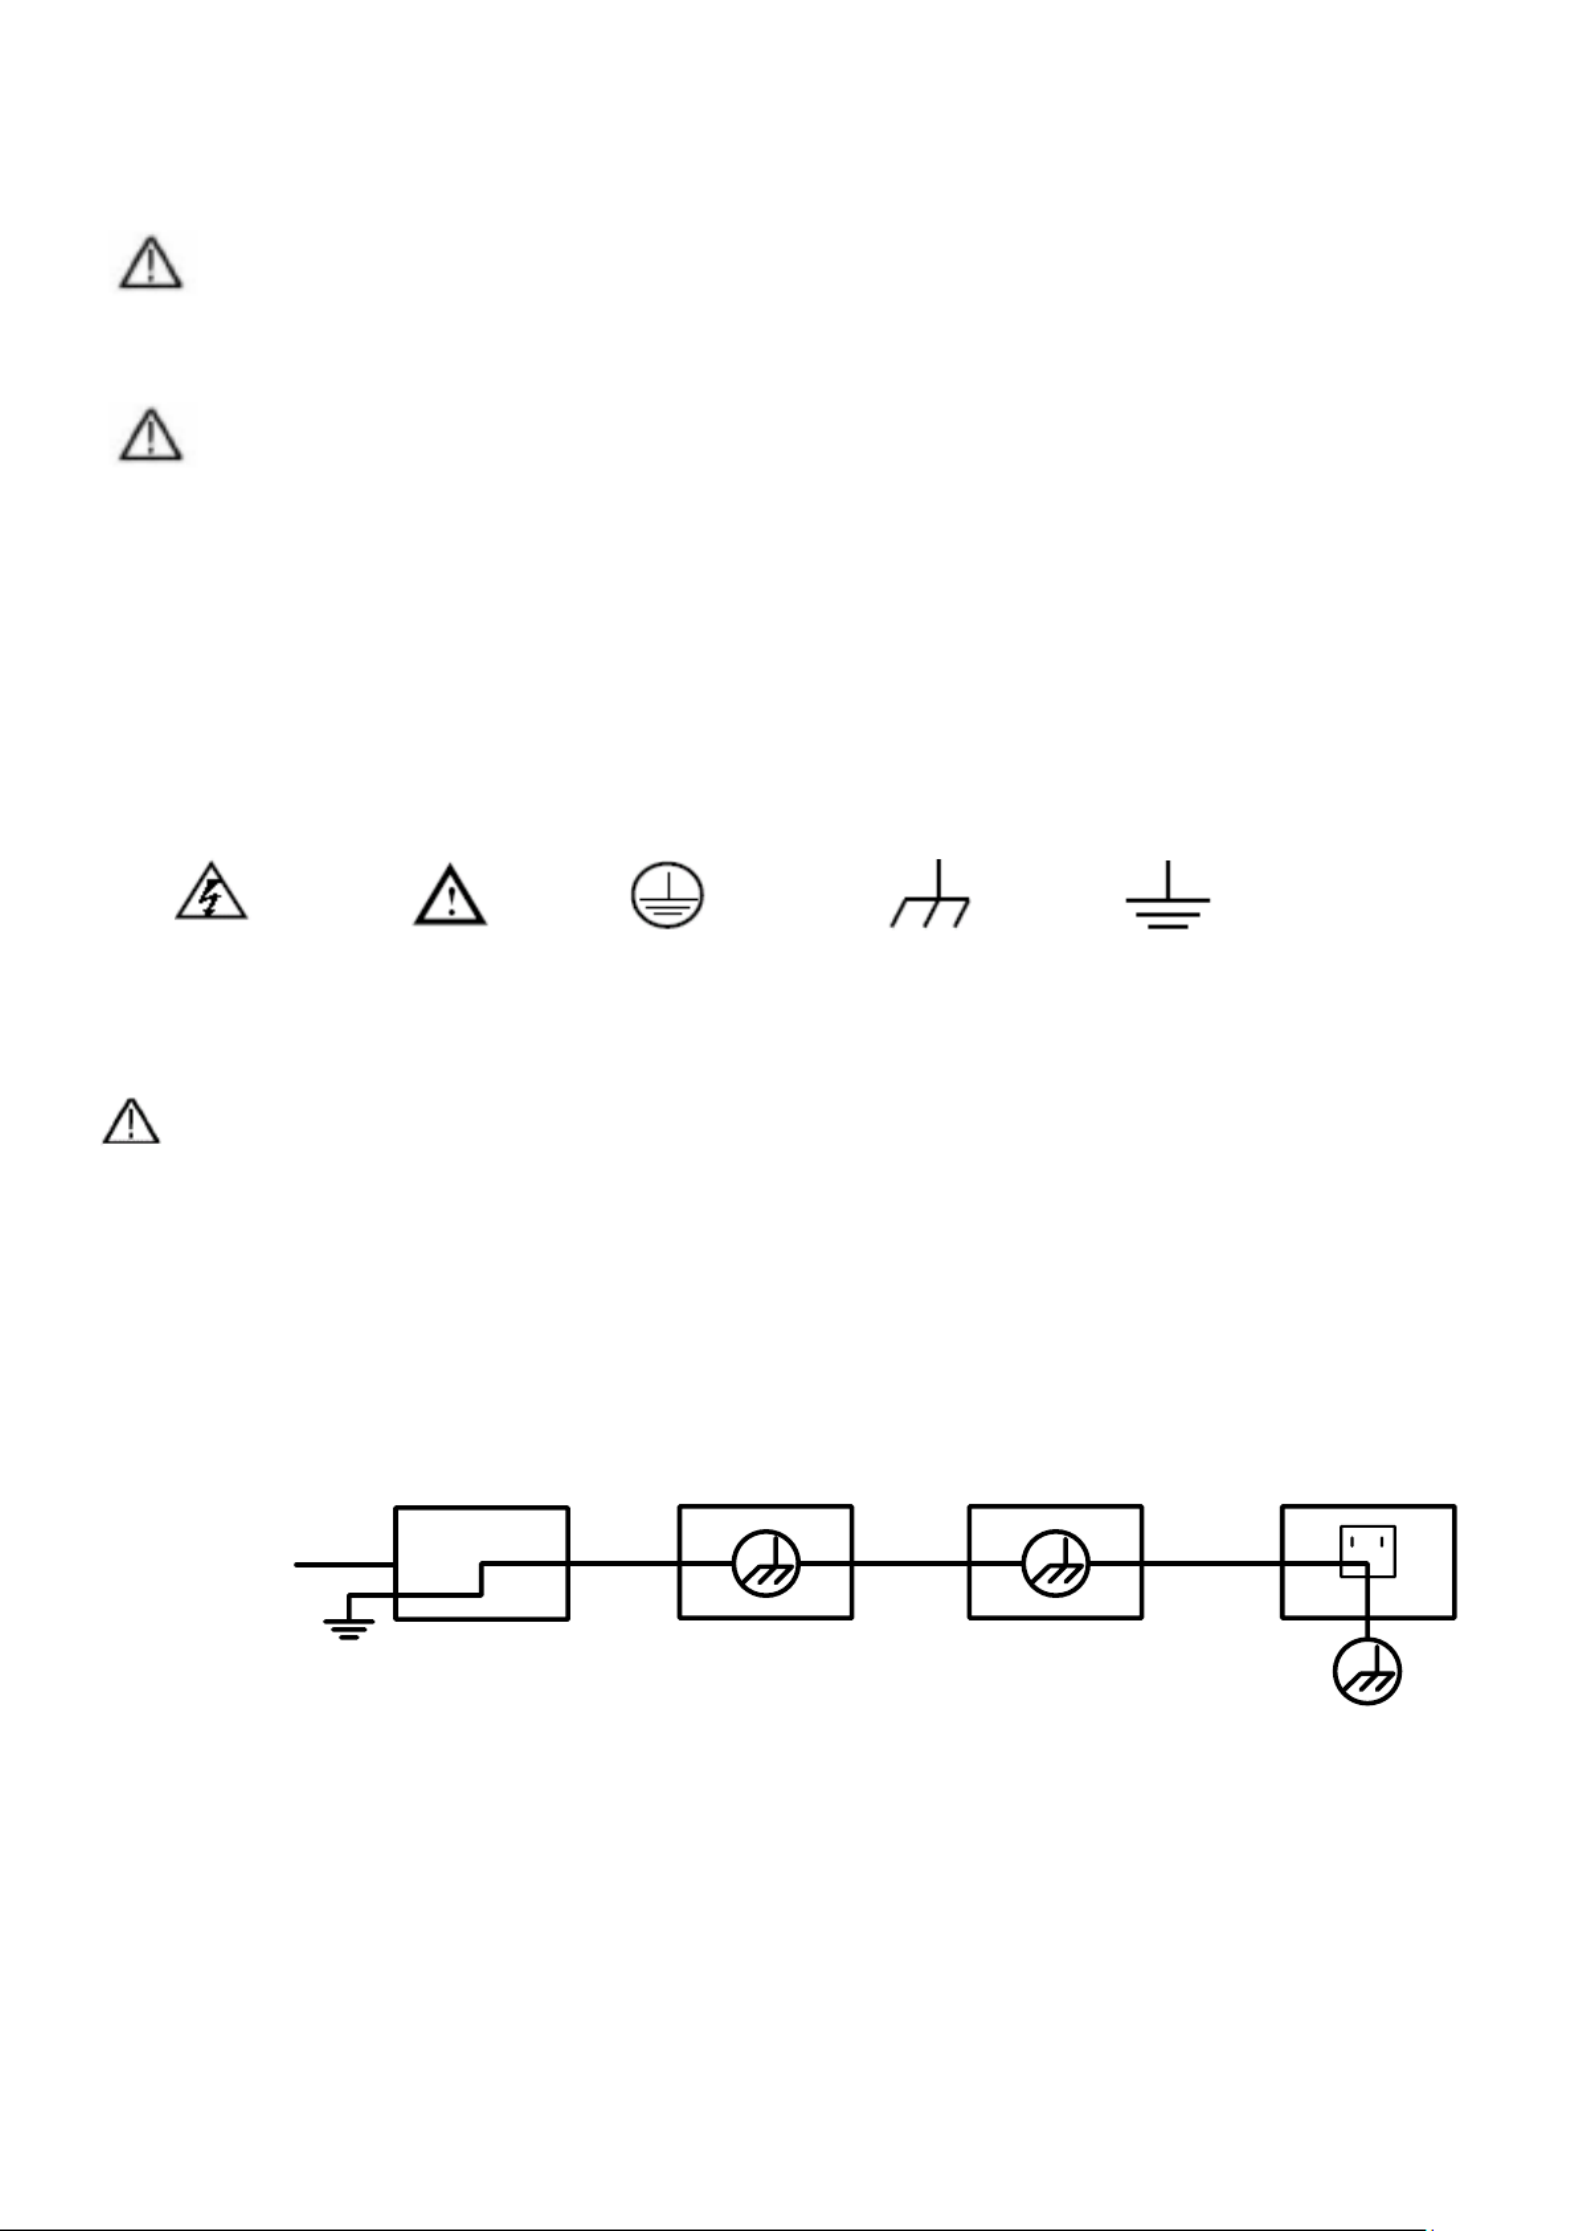
Internal Ground (GND) Wiring Diagram:
Due to the internally connected earth terminals between the BNC socket, USB port and IEC
connector, the mains voltage should not be measured when the oscilloscope is operated
with mains voltage in conjunction with a PC operated with mains voltage. In the event of a
fault, a voltage flashover could occur across the GND of the PC.
Ground Clip
Signal Input
Electrical Outlet
Probe Oscilloscope AC Adapter
- - 6
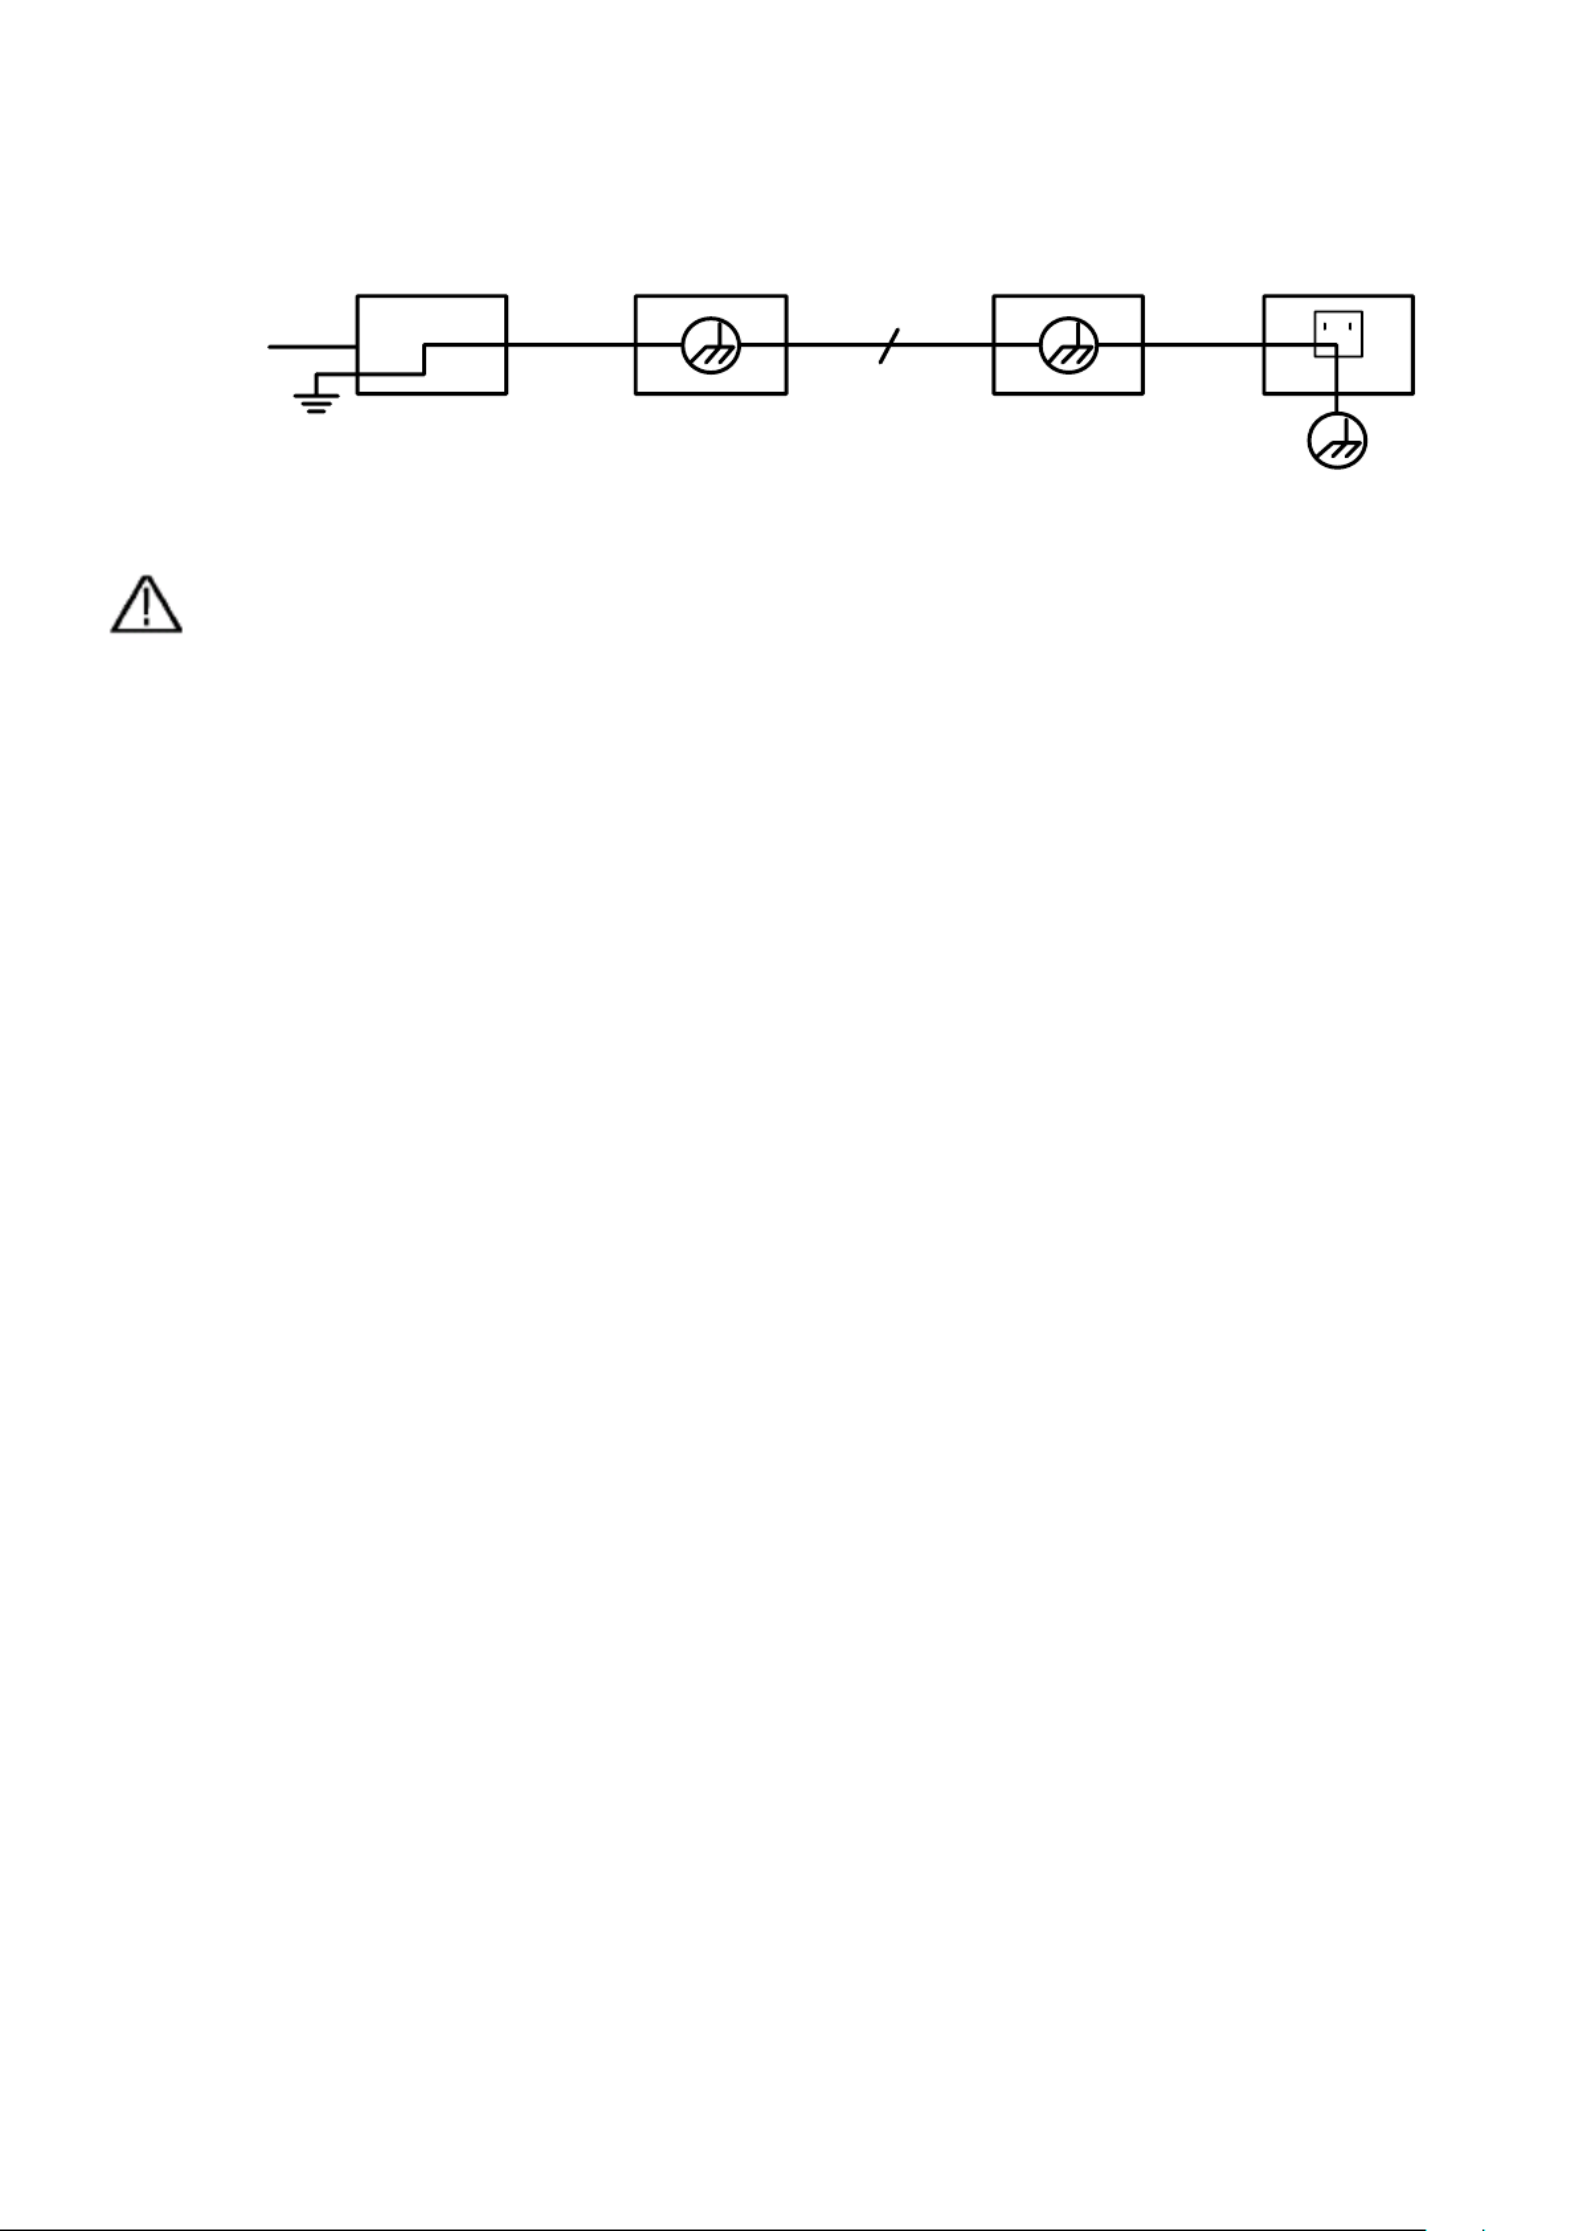
Internal ground (GND) wiring diagram when the oscilloscope is connected to a PC:
Warning:
To avoid fire or electric shock, please observe the following points
when the connected oscilloscope input signal is greater than 42 Vpp
(30 Vrms) or circuits greater than 4800 VA:
1. Use only insulated measuring probes and measuring lines
2. Check the accessories for damage and functionality before use
3. Remove the test leads and any accessories after measurement
/ use
4. Remove the USB cable from the oscilloscope before each
measurement
5. Make sure that the voltage to be measured does not exceed the
maximum input voltage of the device, as the measuring voltage
is transmitted directly from the measuring probe to the
oscilloscope
6. Do not use damaged connection cables, e.g. damaged BNC
plugs
7. Do not insert any bare metal objects into the connections of the
device
Ground Clip
Signal Input
Oscilloscope
(Battery-power) PC Electrical OutletProbe
USB/LAN Cable
- - 9
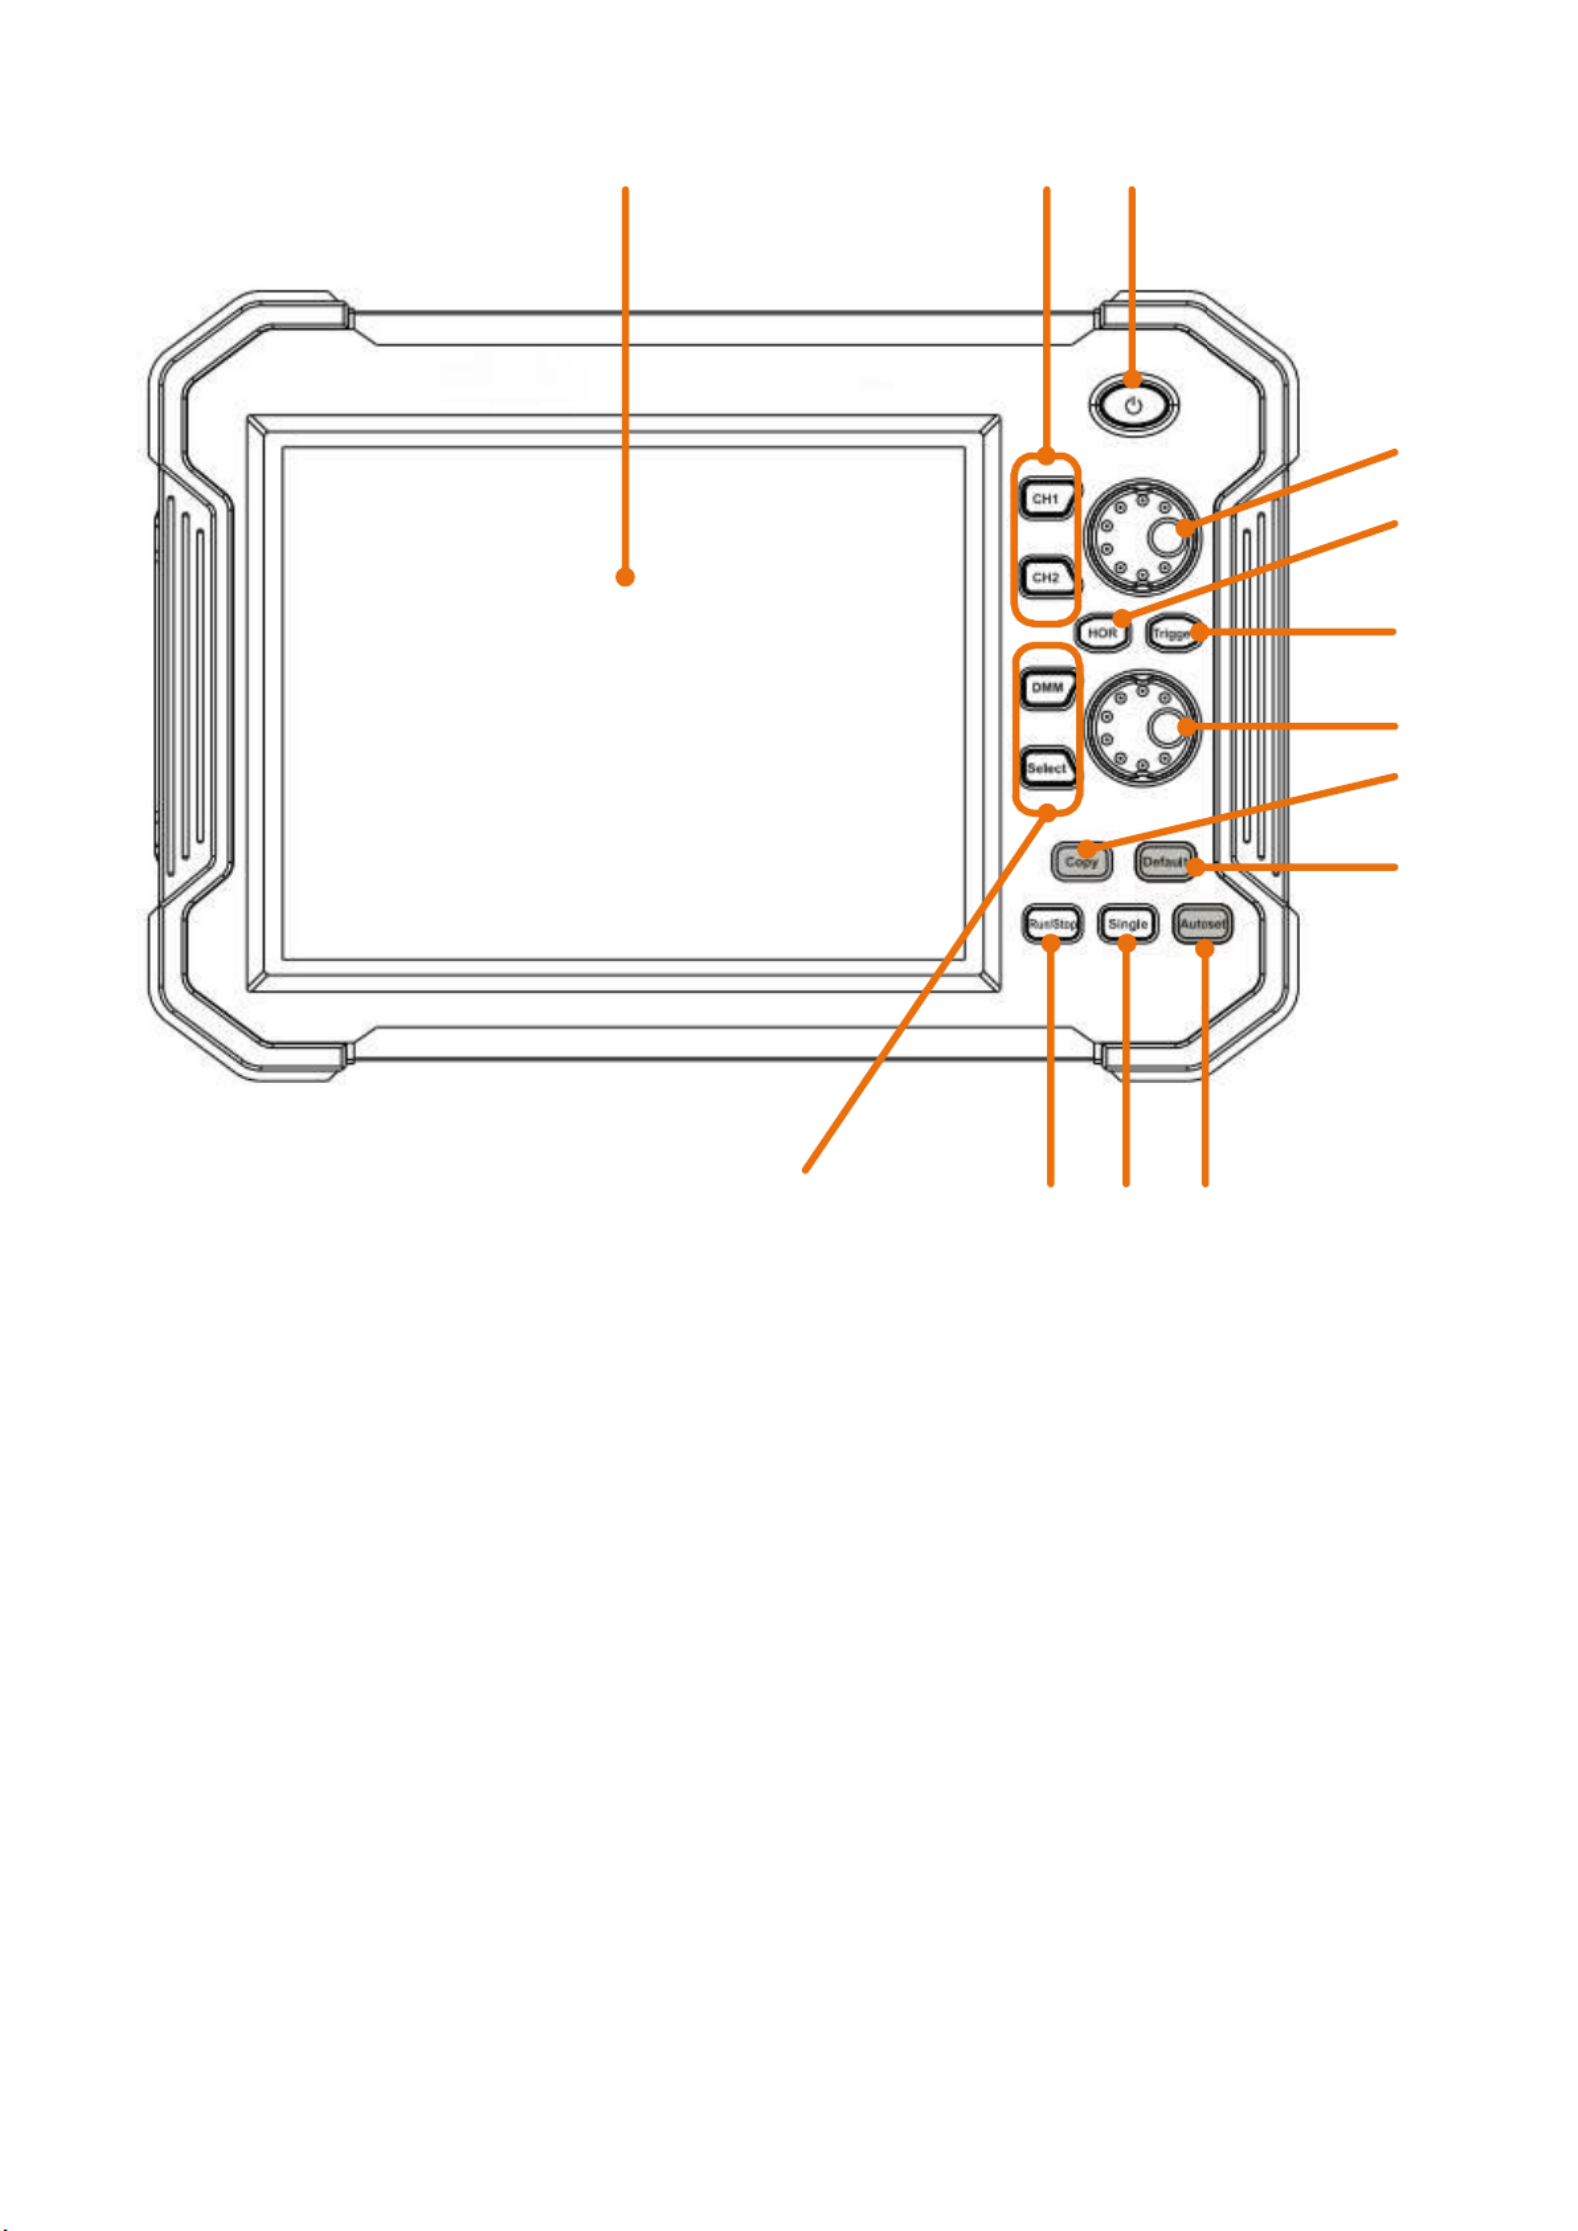
Figure 1.1 Front view (2 channel oscilloscope)
1. LCD Touchscreen
2. 4CH Oscilloscope: CH buttons CH 1 – CH 4 /
2CH Osciloscope buttons CH 1 + CH 2:
3. Main switch for switching the device on and off
4. When a channel button lights up, the vertical position of the channel is set with the rotary
button. When the HOR button is lit, the horizontal position of the channels is set (including
math operations)
5. The HOR key is used to adjust the horizontal position of the various channels using the
rotary knobs.
6. The trigger button is used to set the respective trigger level for the various channels. To do
this, the lower rotary knob is used after activating the trigger button.
7. Rotary knob for setting the trigger level and the horizontal position of the measurement
voltage
8. Using the Copy button, it is possible to save the current measurement
9. Button for restoring the factory settings. When pressed, you will be asked to press the
button again to restore the factory settings
10. Autoset button for quick configuration of the oscilloscope to the current measurement signal
11. With the single button you are able to apply the trigger individually to a channel
12. Activates or deactivate the sampling of the input signal
13. Activates and deactivate the multimeter function
10
1 3
4
7
12 11
9
6
2
5
8
13
- - 10
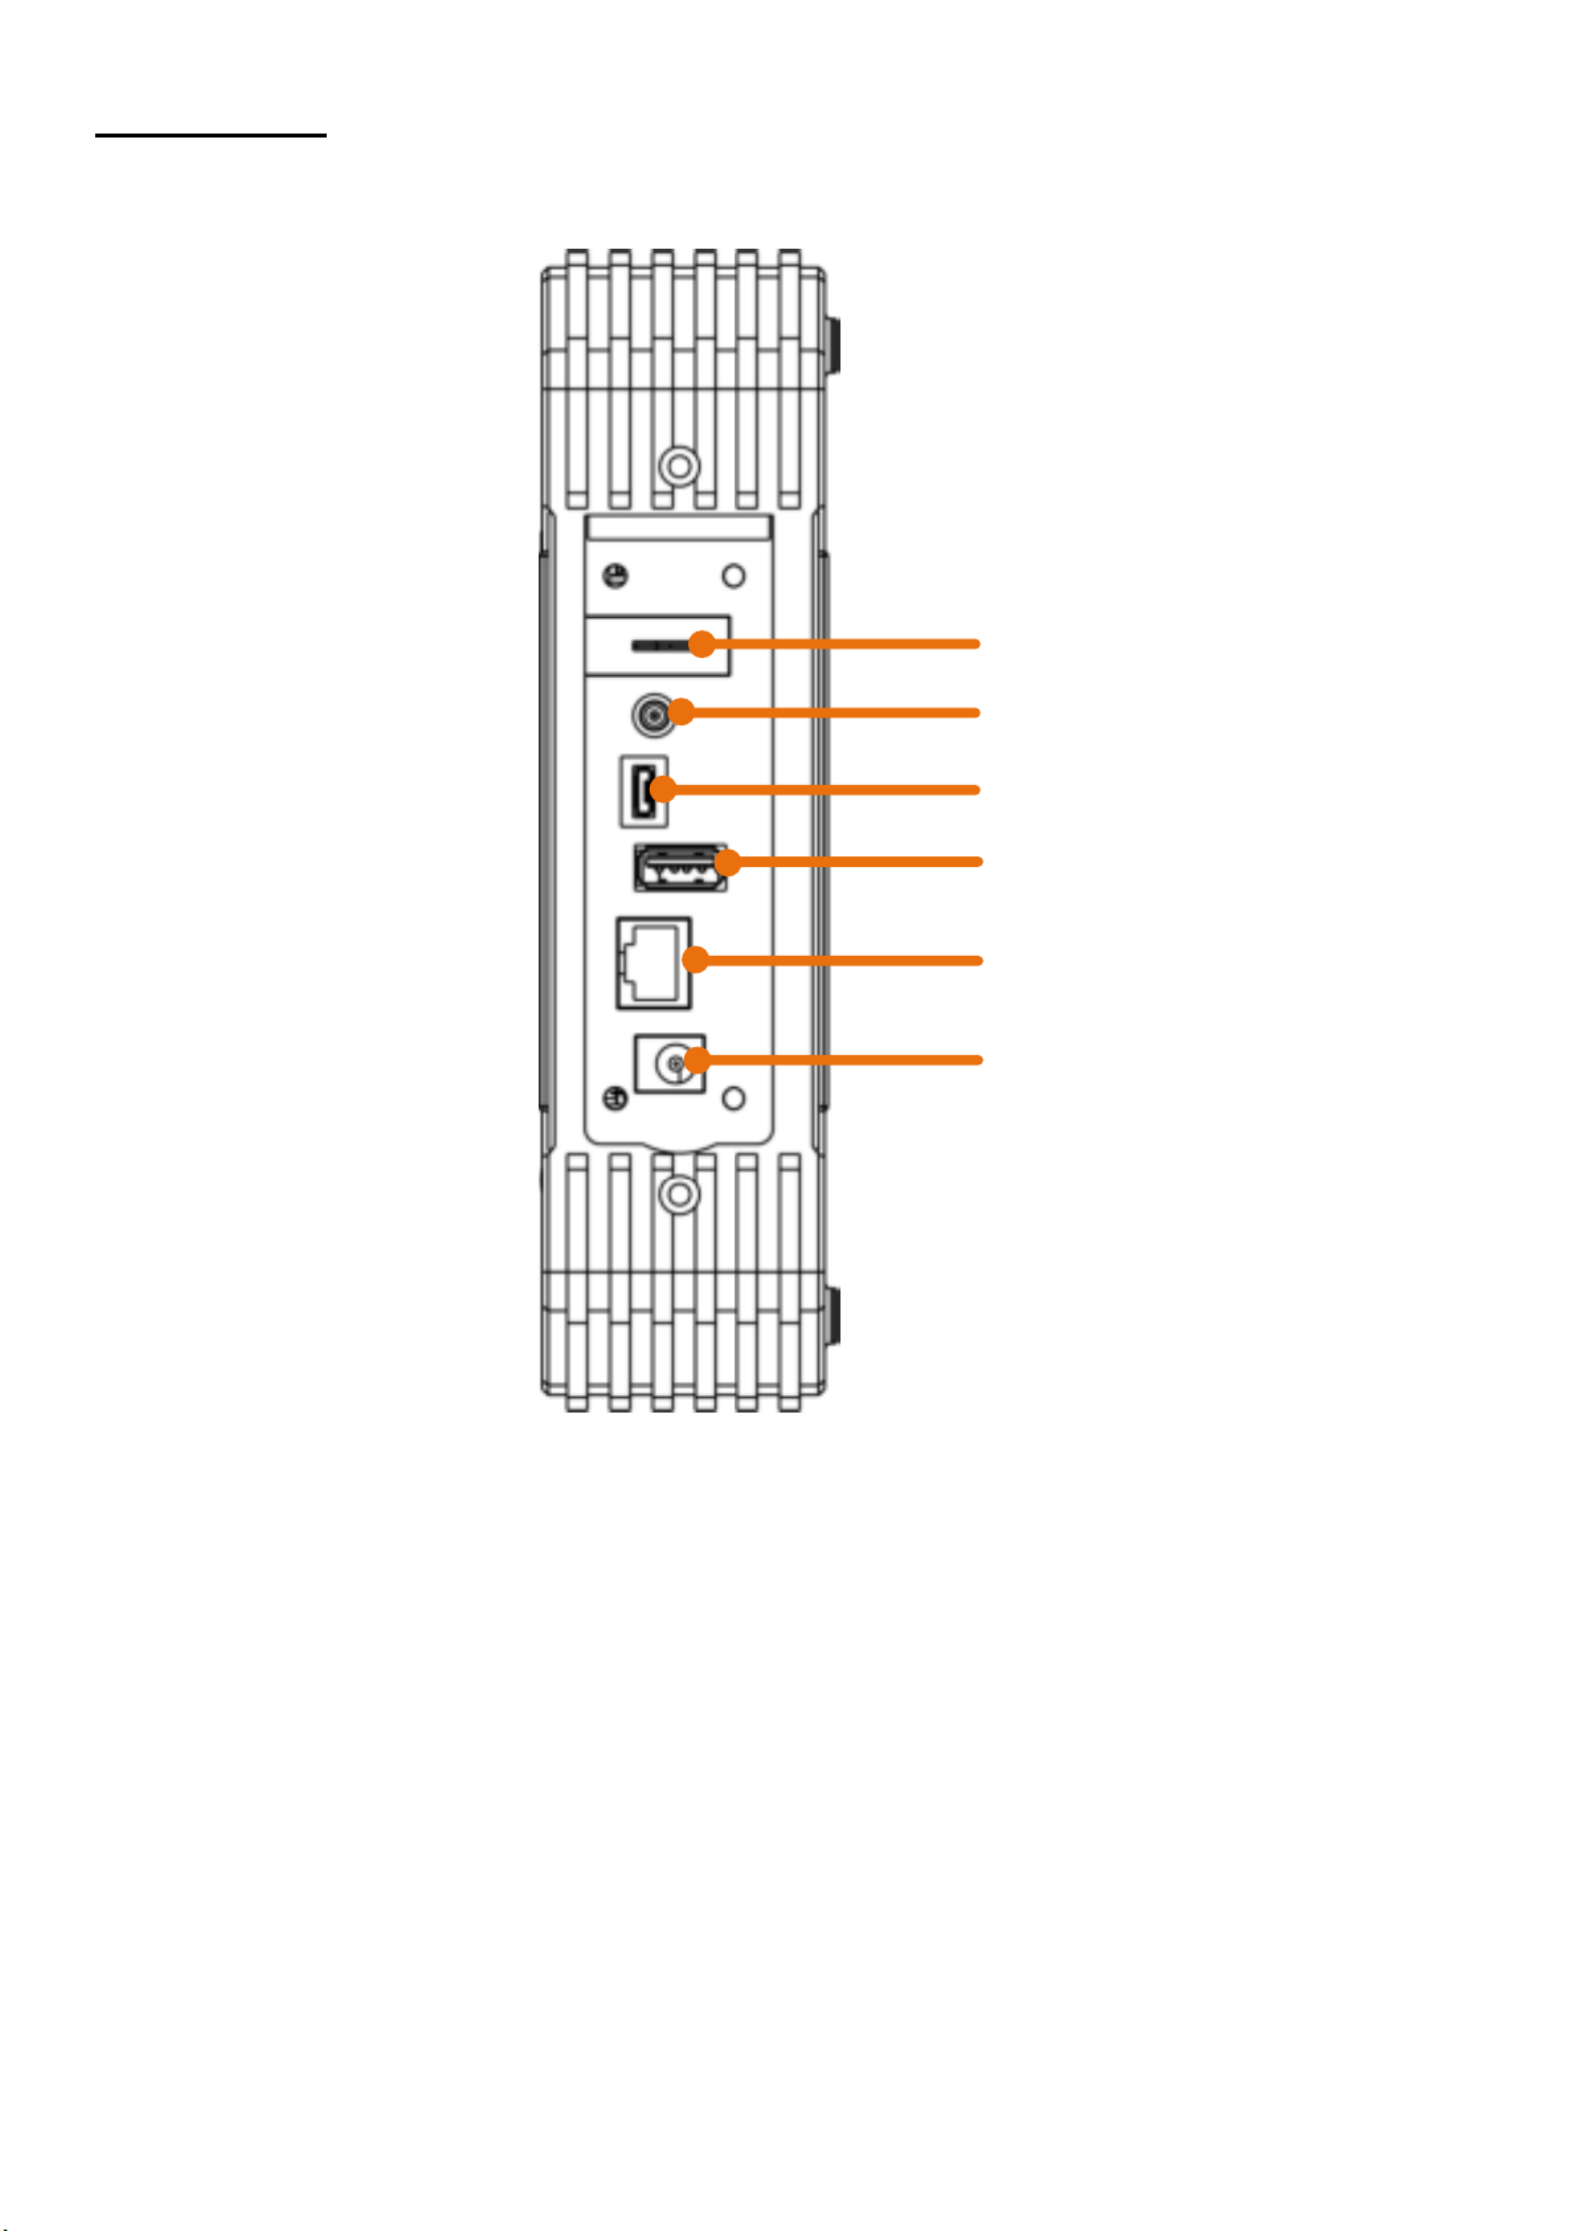
3.2 Side view
Figure 1.2 Side view
1. Probe compensation: output of the 5V / 1kHz measuring signal
2. Output connection for the trigger and the pass / fail function (output type can be changed in
the menu Tool Function output output)
3. USB device connection for transferring saved data e.g. to a PC
4. USB port for direct storage of data, e.g. on a USB stick
5. LAN port for connection to a PC
6. Charging connection socket for the enclosed charging adapter
1
2
3
4
5
6
- - 11
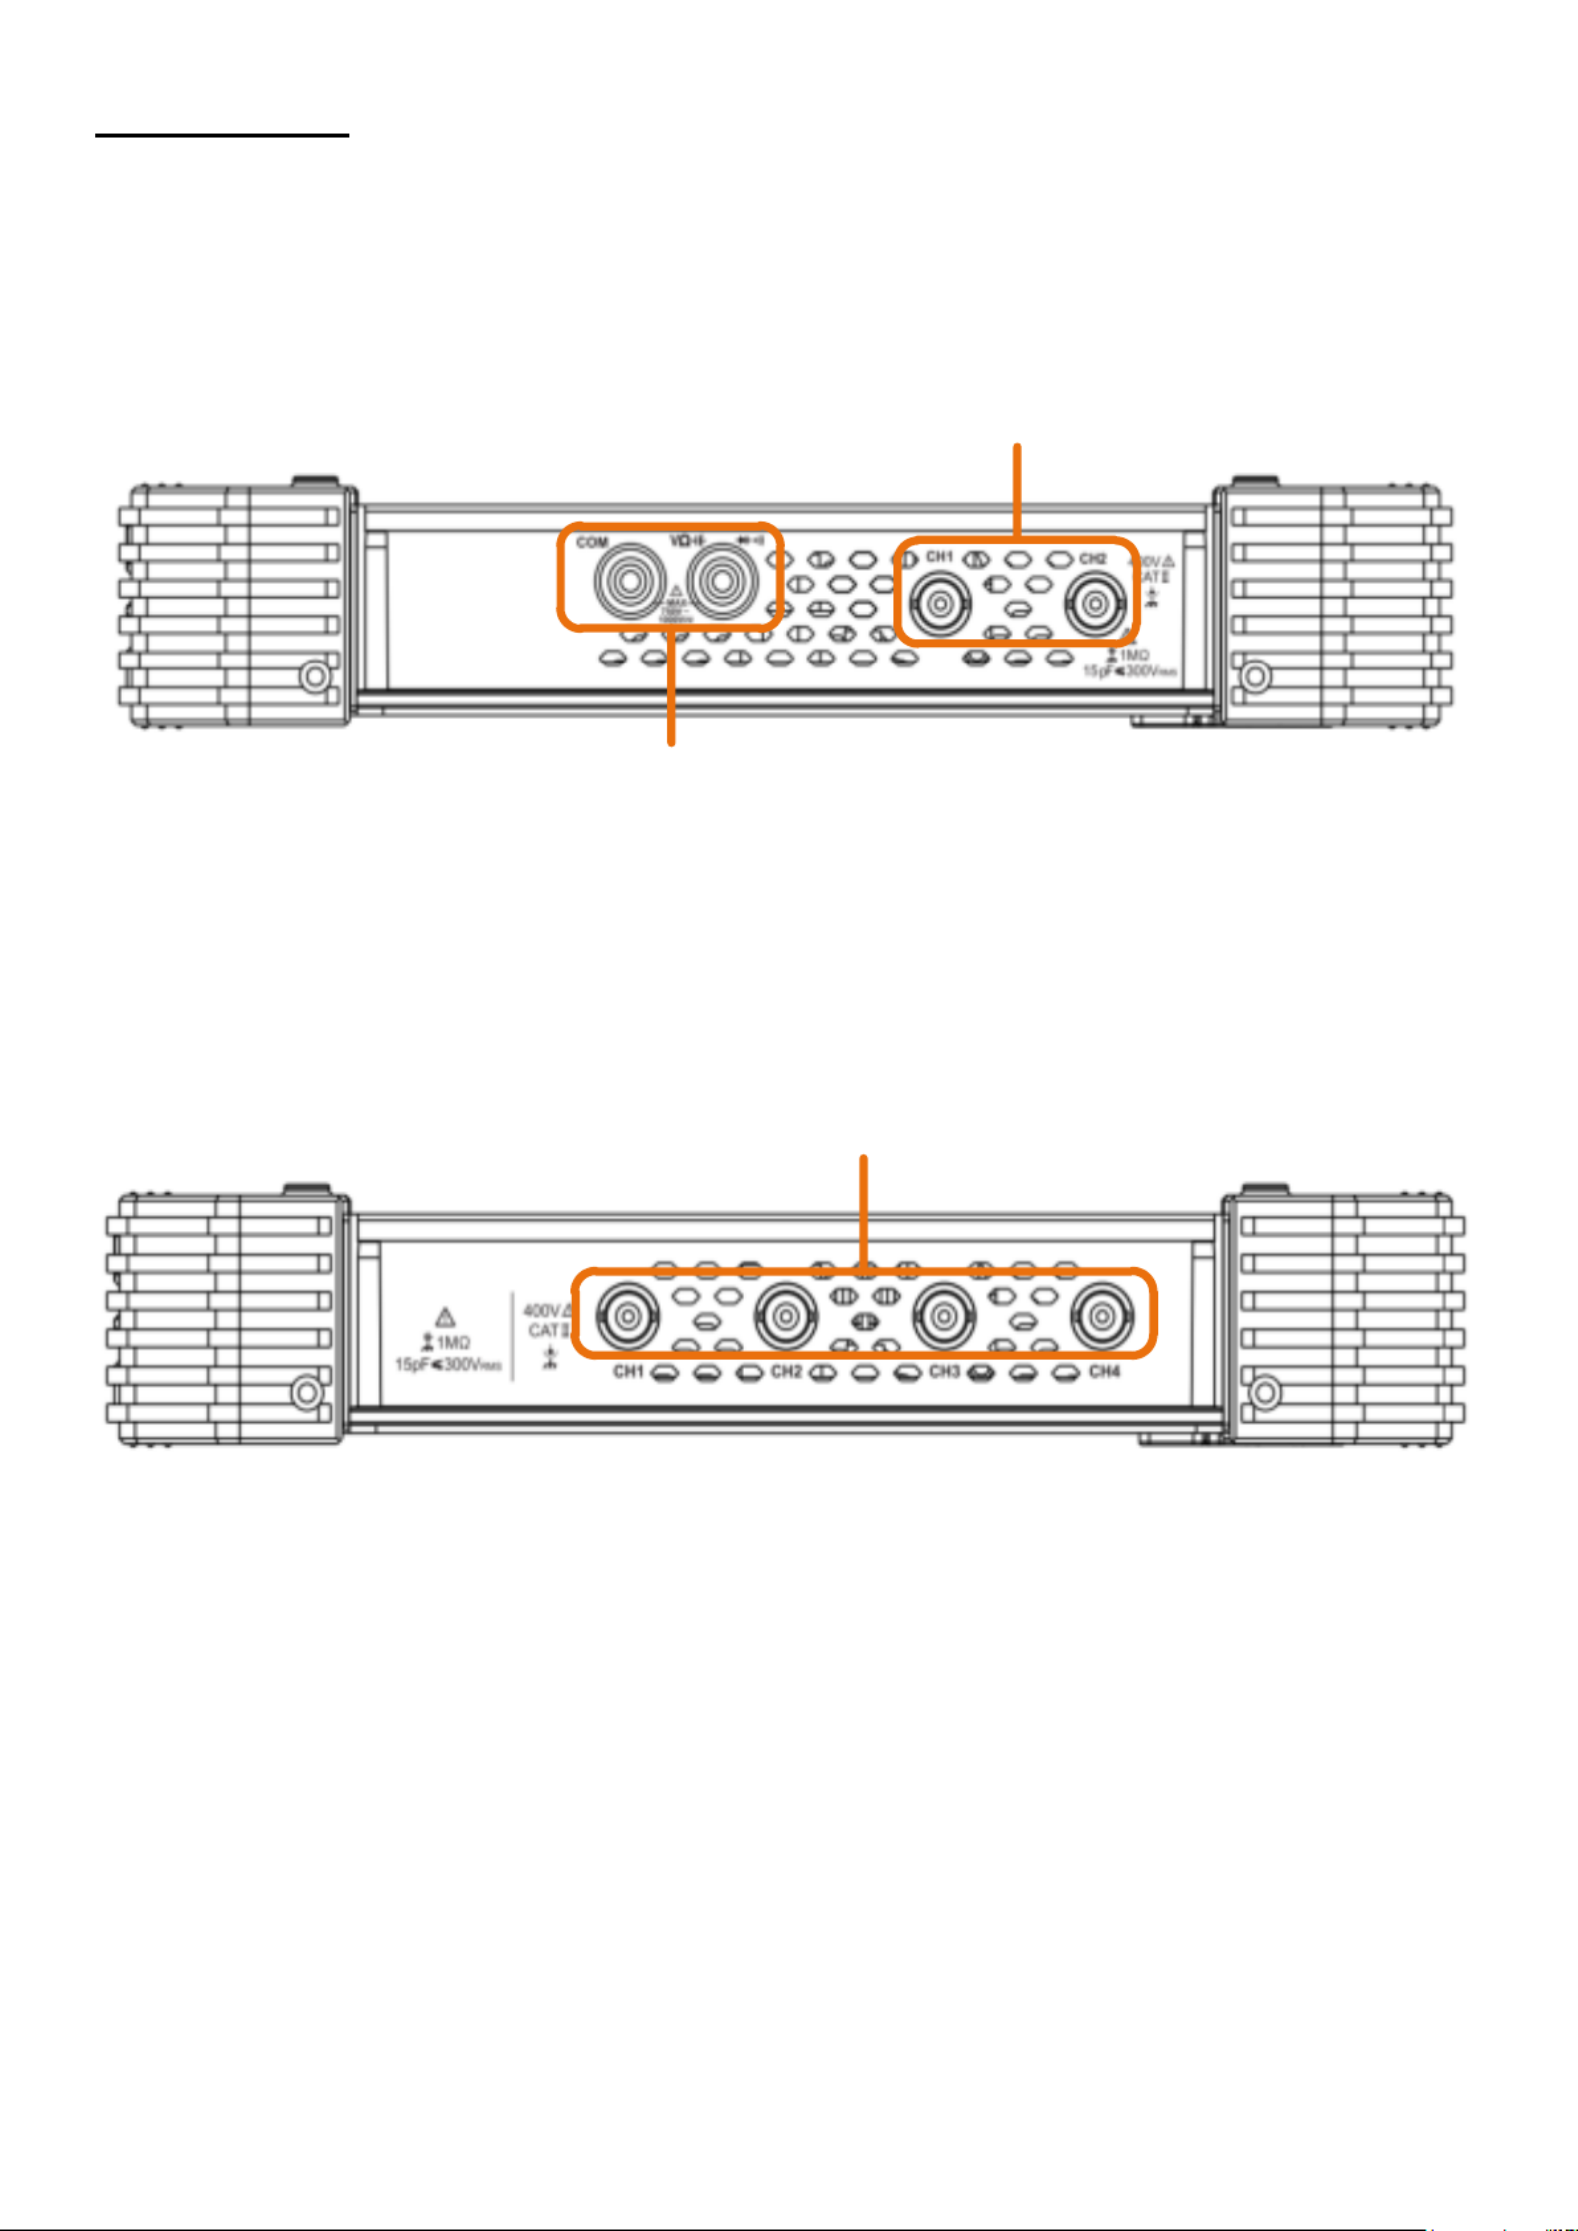
3.3 Upper side
Figure 3 Upper side of the 2 channel oscilloscope (PeakTech 1206, 1207) 1.
Figure 1.4 Upper side of the 4 channel oscilloscope (PeakTech 1211, 1212)
Input connectors of channels
Input connectors of multimeter
Input connectors of four channels
- - 12
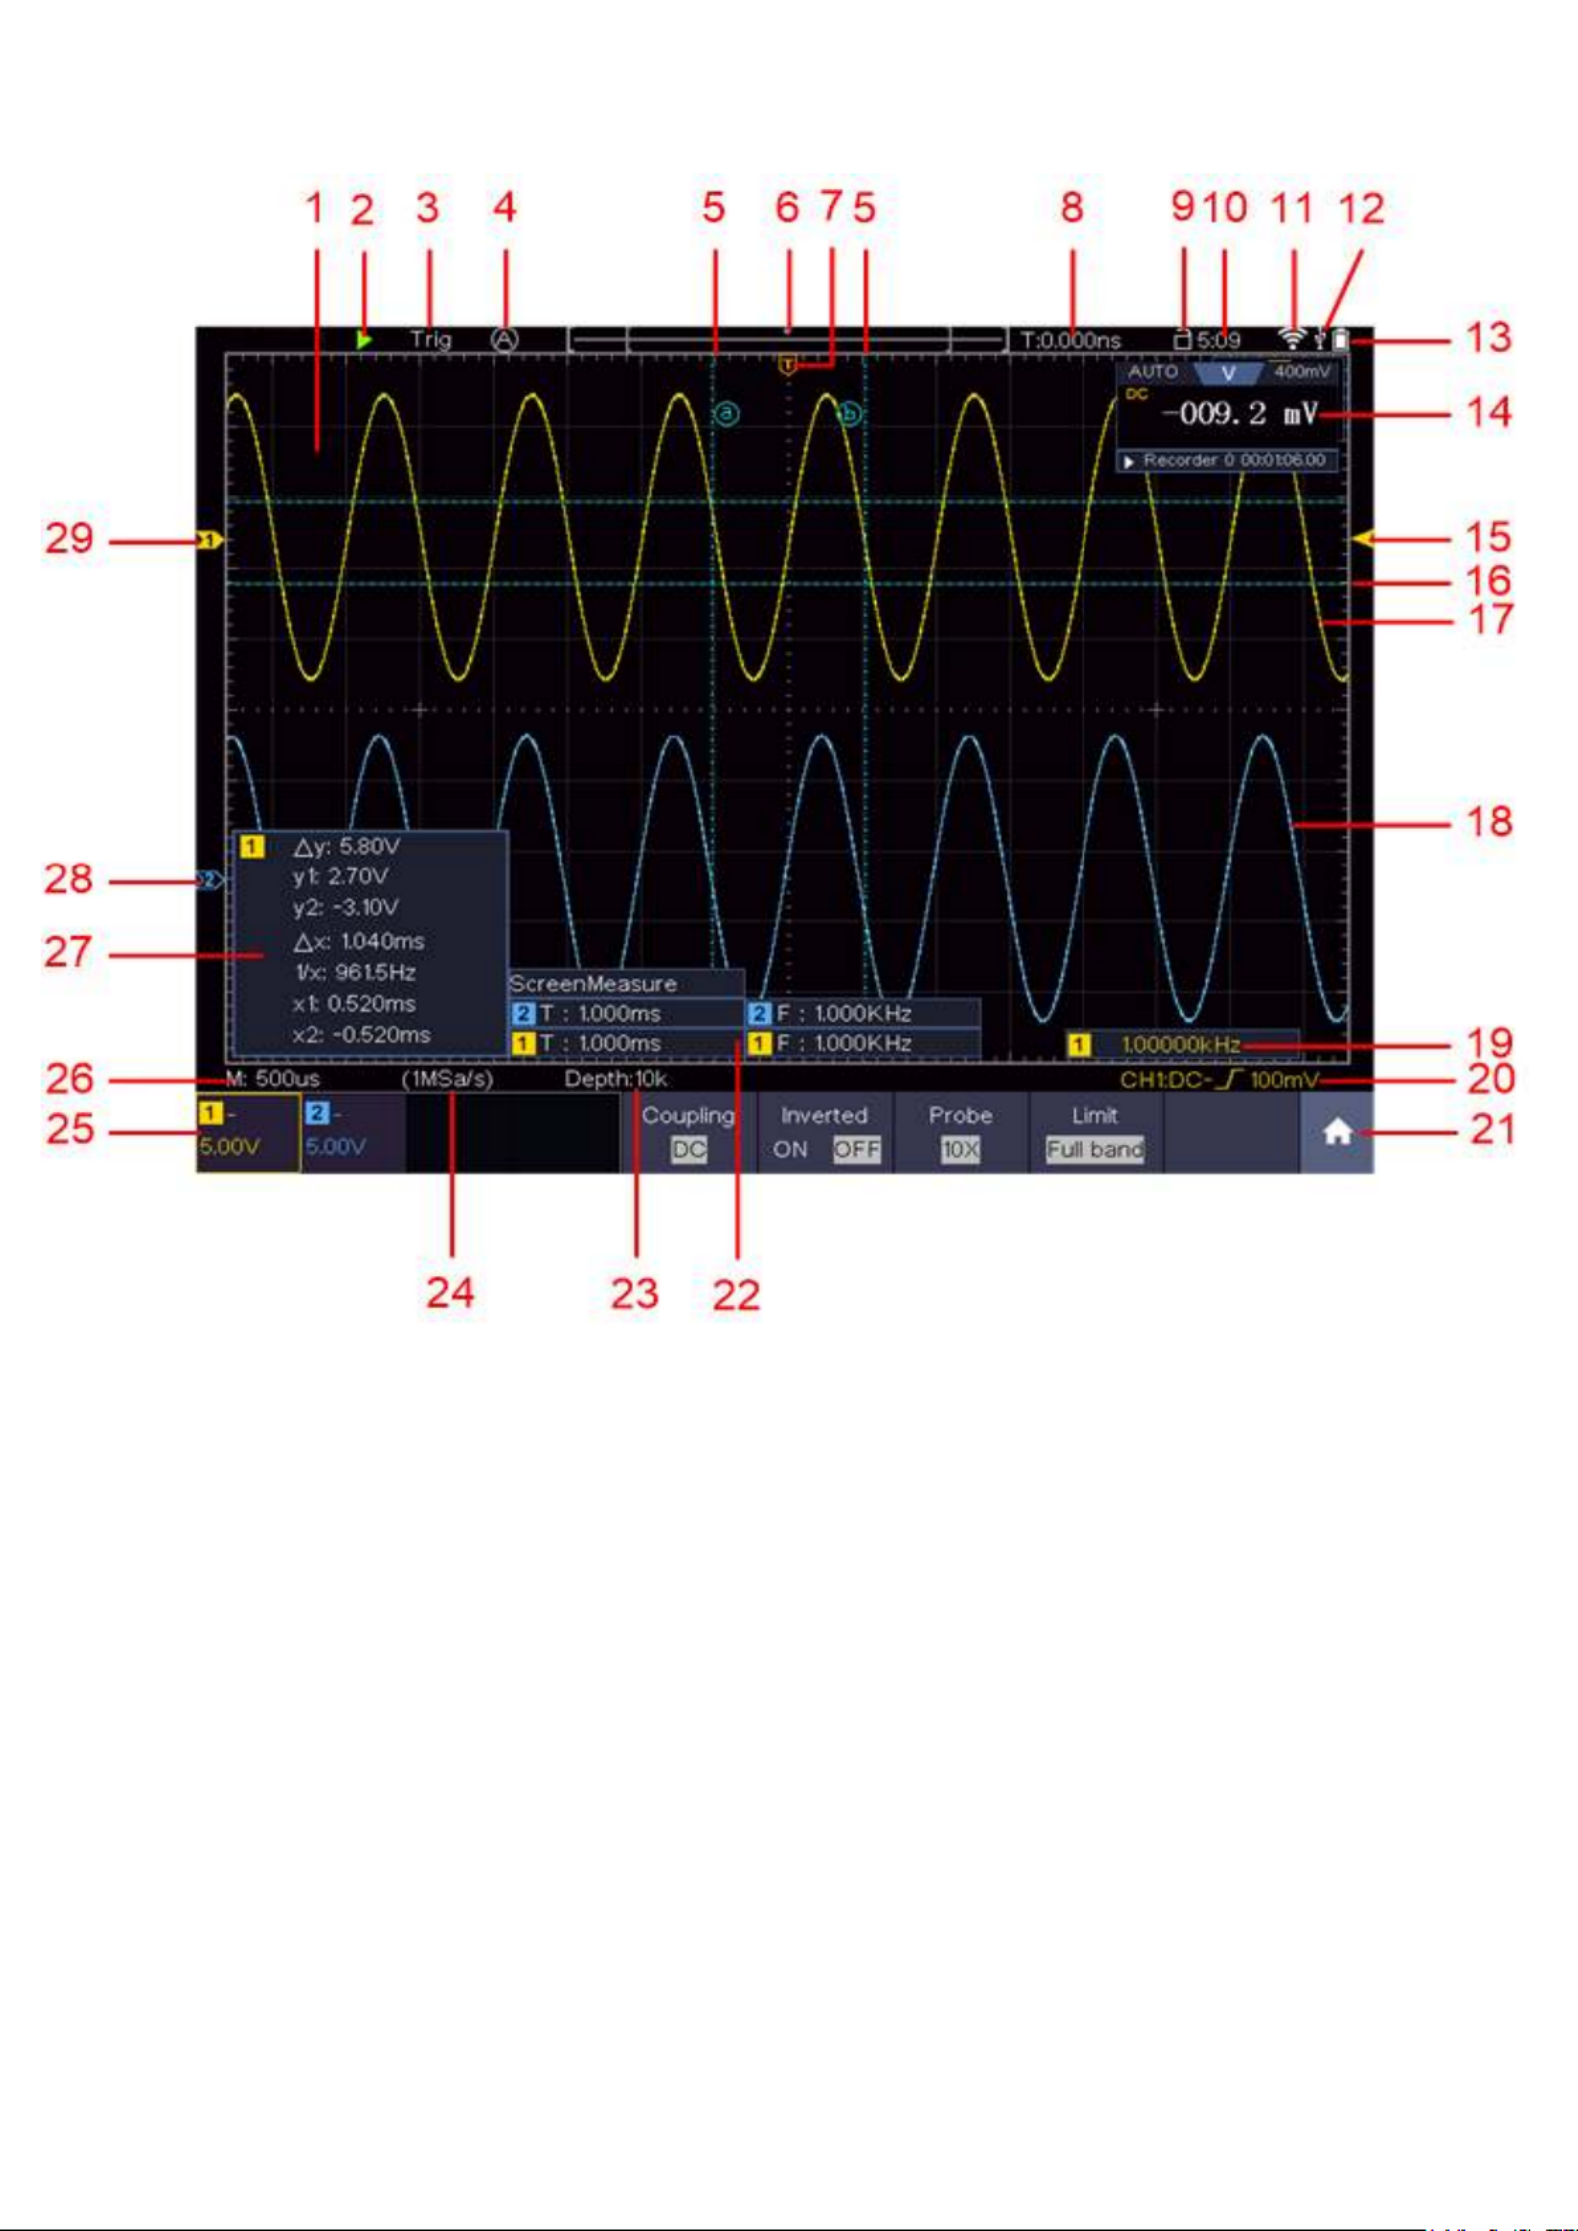
4. Introduction to the user interface
Figure 2.0 User interface
1. Display range of the measured values
2. Start / stop the measurement (measurement activated / deactivated)
3. Display of the selected mode
4. Automatic setting for displaying the measured value
5. Representation of the vertical position of the cursor measurement
6. Display of the current trigger position of the bandwidth
7. Display of the horizontal trigger position
8. Display of the current trigger value and the location of the internal memory
9. Option to lock the touchscreen operation
10. Time display
11. Wifi display
12. Display when an external USB device is connected
13. Battery level indicator
14. Display of the multimeter function
15. Channel 1 waveform
16. Display of the trigger position of the channel
17. Display of the horizontal position of the measuring cursor
18. Channel 2 waveform

- - 13
19. Display of the frequency of the triggered signal
20. Display of the current trigger type
21. Selection to display the submenu items
22. Display of the measured type of the corresponding channel
23. Display of the recording length of the measured values
24. Display of the current sampling rate
25. Display of voltage division, zero point position and bandwidth limit, as well as symbol for
coupling type
26. Display of the set main time base
27. Window to show the absolute measured values of the respective channel
28. Position of the zero point position of the channel 2 waveform
29. Position of the zero point position of the channel 1 waveform
5. Check before commissioning
After receiving a new oscilloscope, it is recommended that you test the device as follows:
1. Check whether the device has been damaged in transit.
If you note that the cardboard packaging or the protective foam padding are badly damaged, keep
them until the entire device and its accessories have passed the electrical and mechanical test.
2. Check the accessories
heck that the accessories are complete. If any accessories are missing or damaged, please
contact your dealer.
3. Check the device
If you note any damage to the exterior of the device, or if the device is not working properly or if
the performance test does not pass, please contact your dealer. If the device has been damaged
during transport, please keep the outer packaging and also inform your dealer about the damage.
- - 14
5.1 Functional test
Check the meter is working properly as follows
1. Switch on the device with the main switch " " by pressing and holding the button.
The device performs a self-test and displays the PeakTech logo. If desired, press the “Default”
button to reset the oscilloscope to the factory settings. The default value for the probe
attenuation in the menu is 10X.
2. t an attenuation of 10x on the probe and connect the probe to the CH1 Se
Align the slot on the probe with the channel 1 BNC connector and rotate the probe clockwise to
secure it in place.
Connect the tip of the probe and the earth terminal to the plug of the task head compensator.
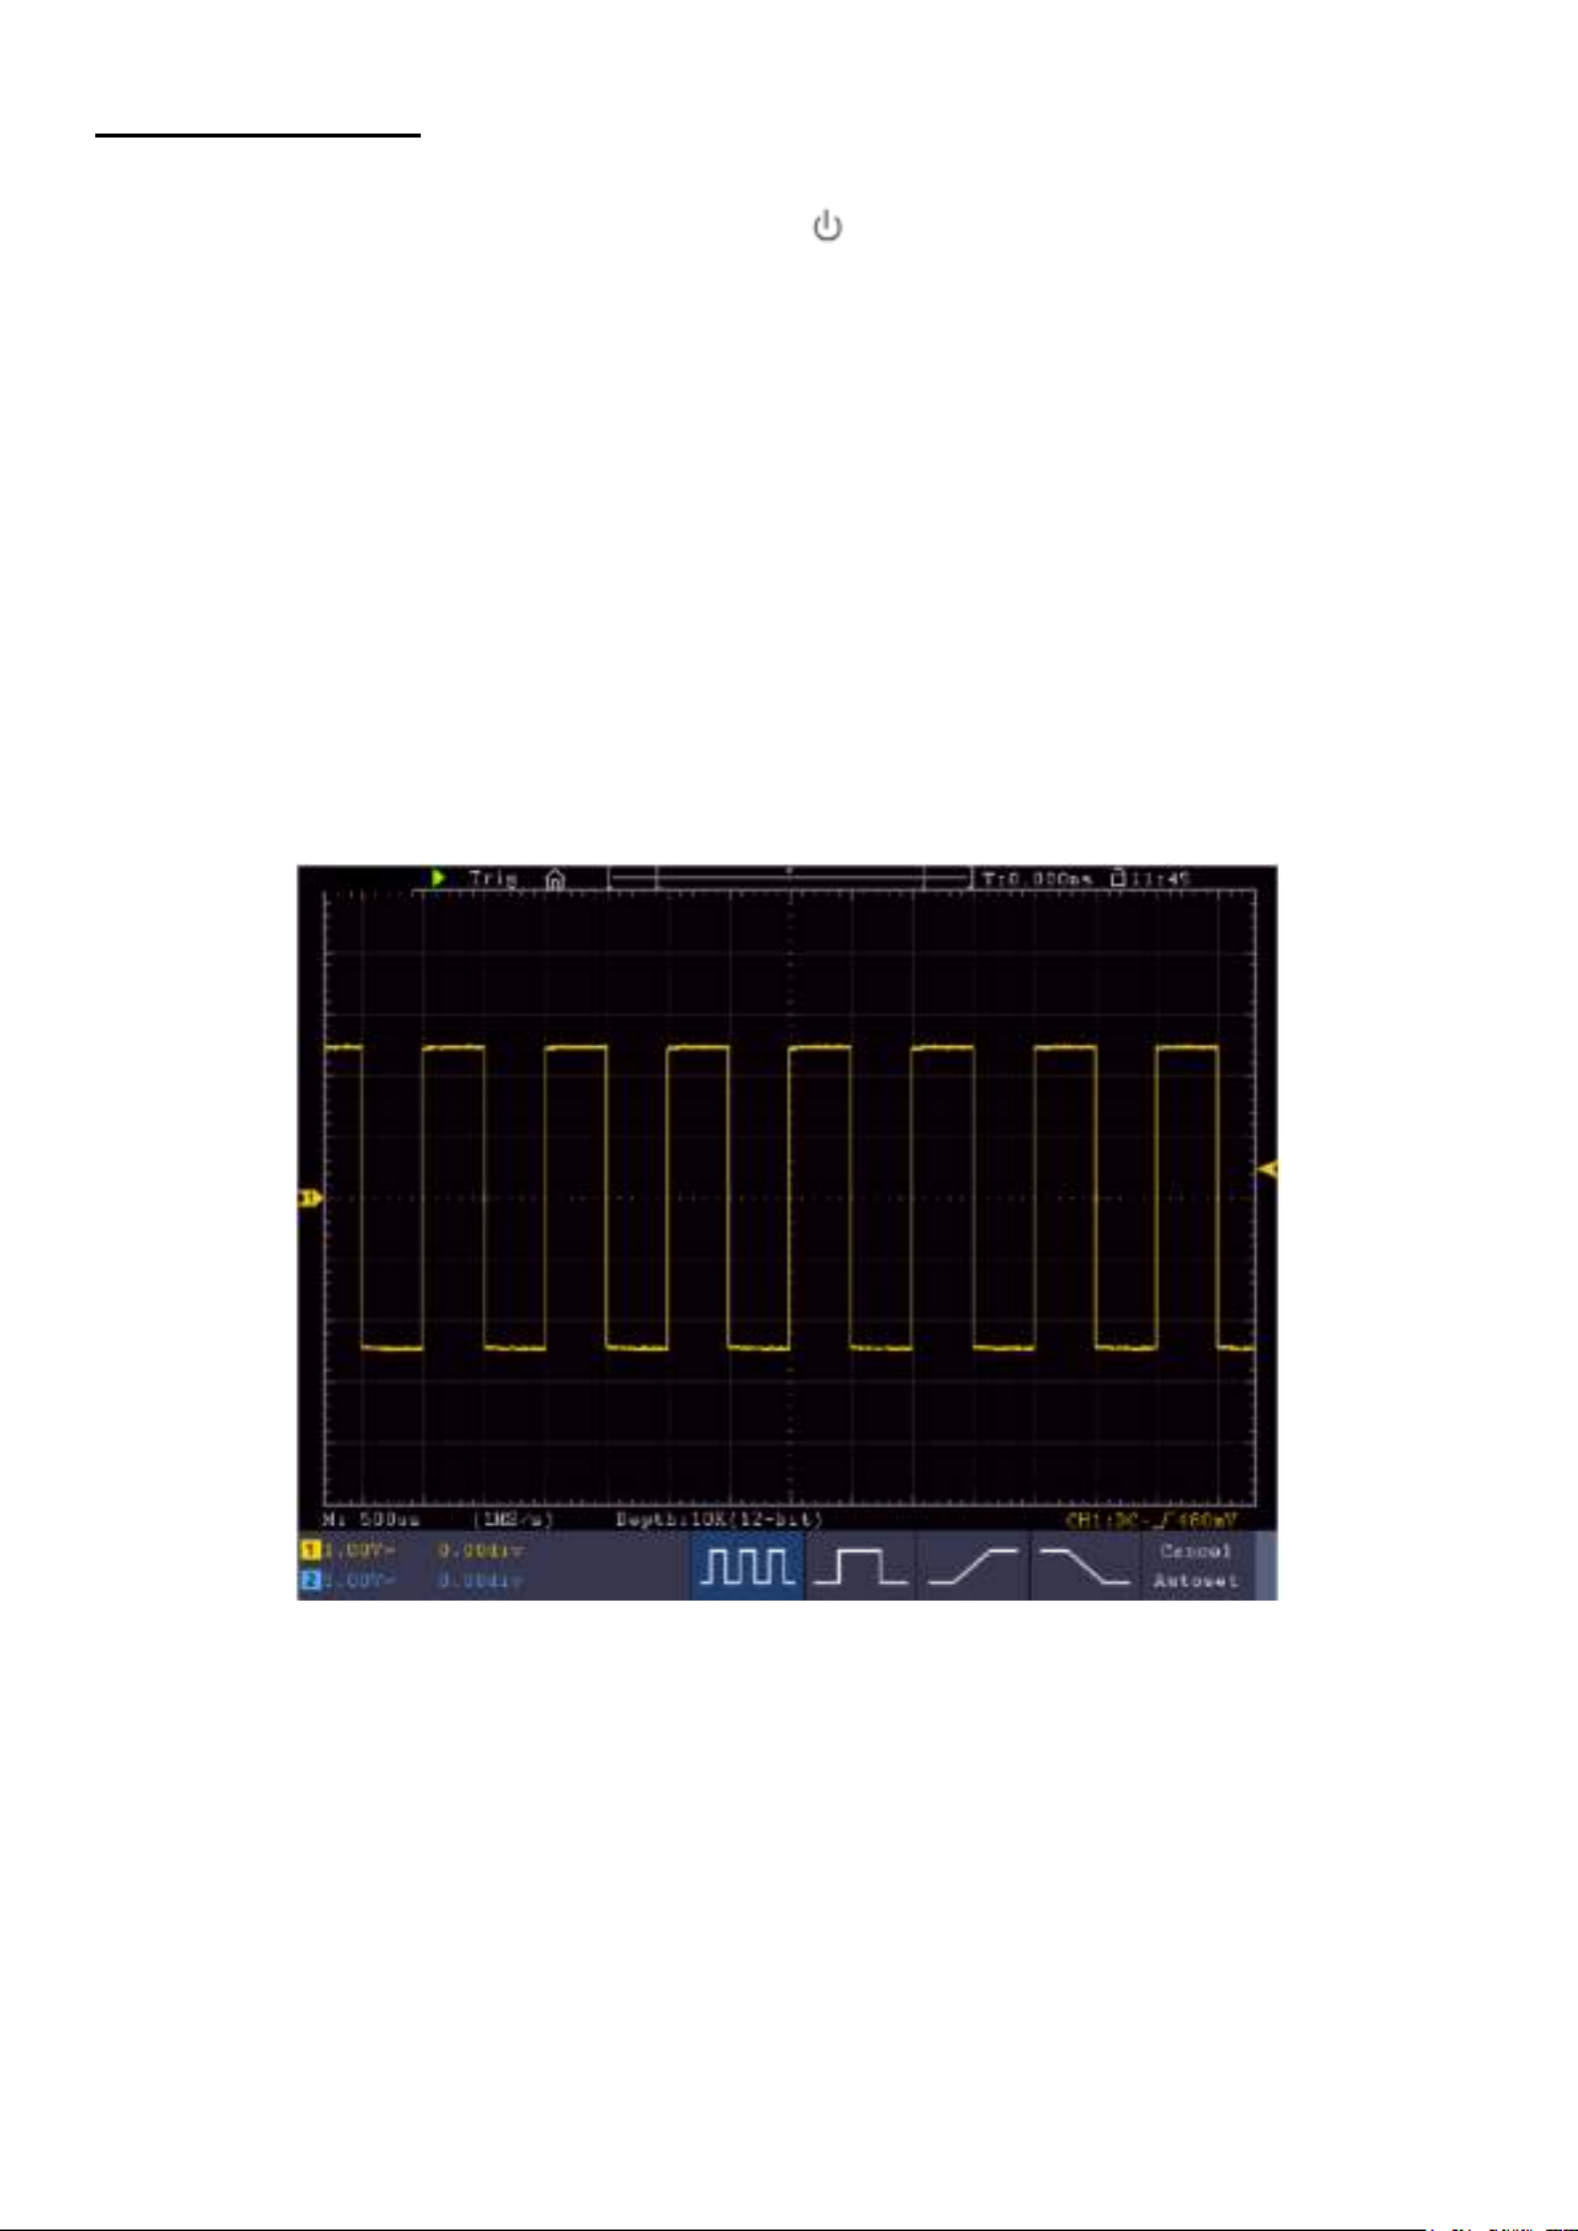
3. Press the “Autoset“ button
The square wave signal with a frequency of 1 KHz and a 5V SS value is displayed after a few
seconds
Figure 3.0 Display of the compensation square wave signal
- - 15
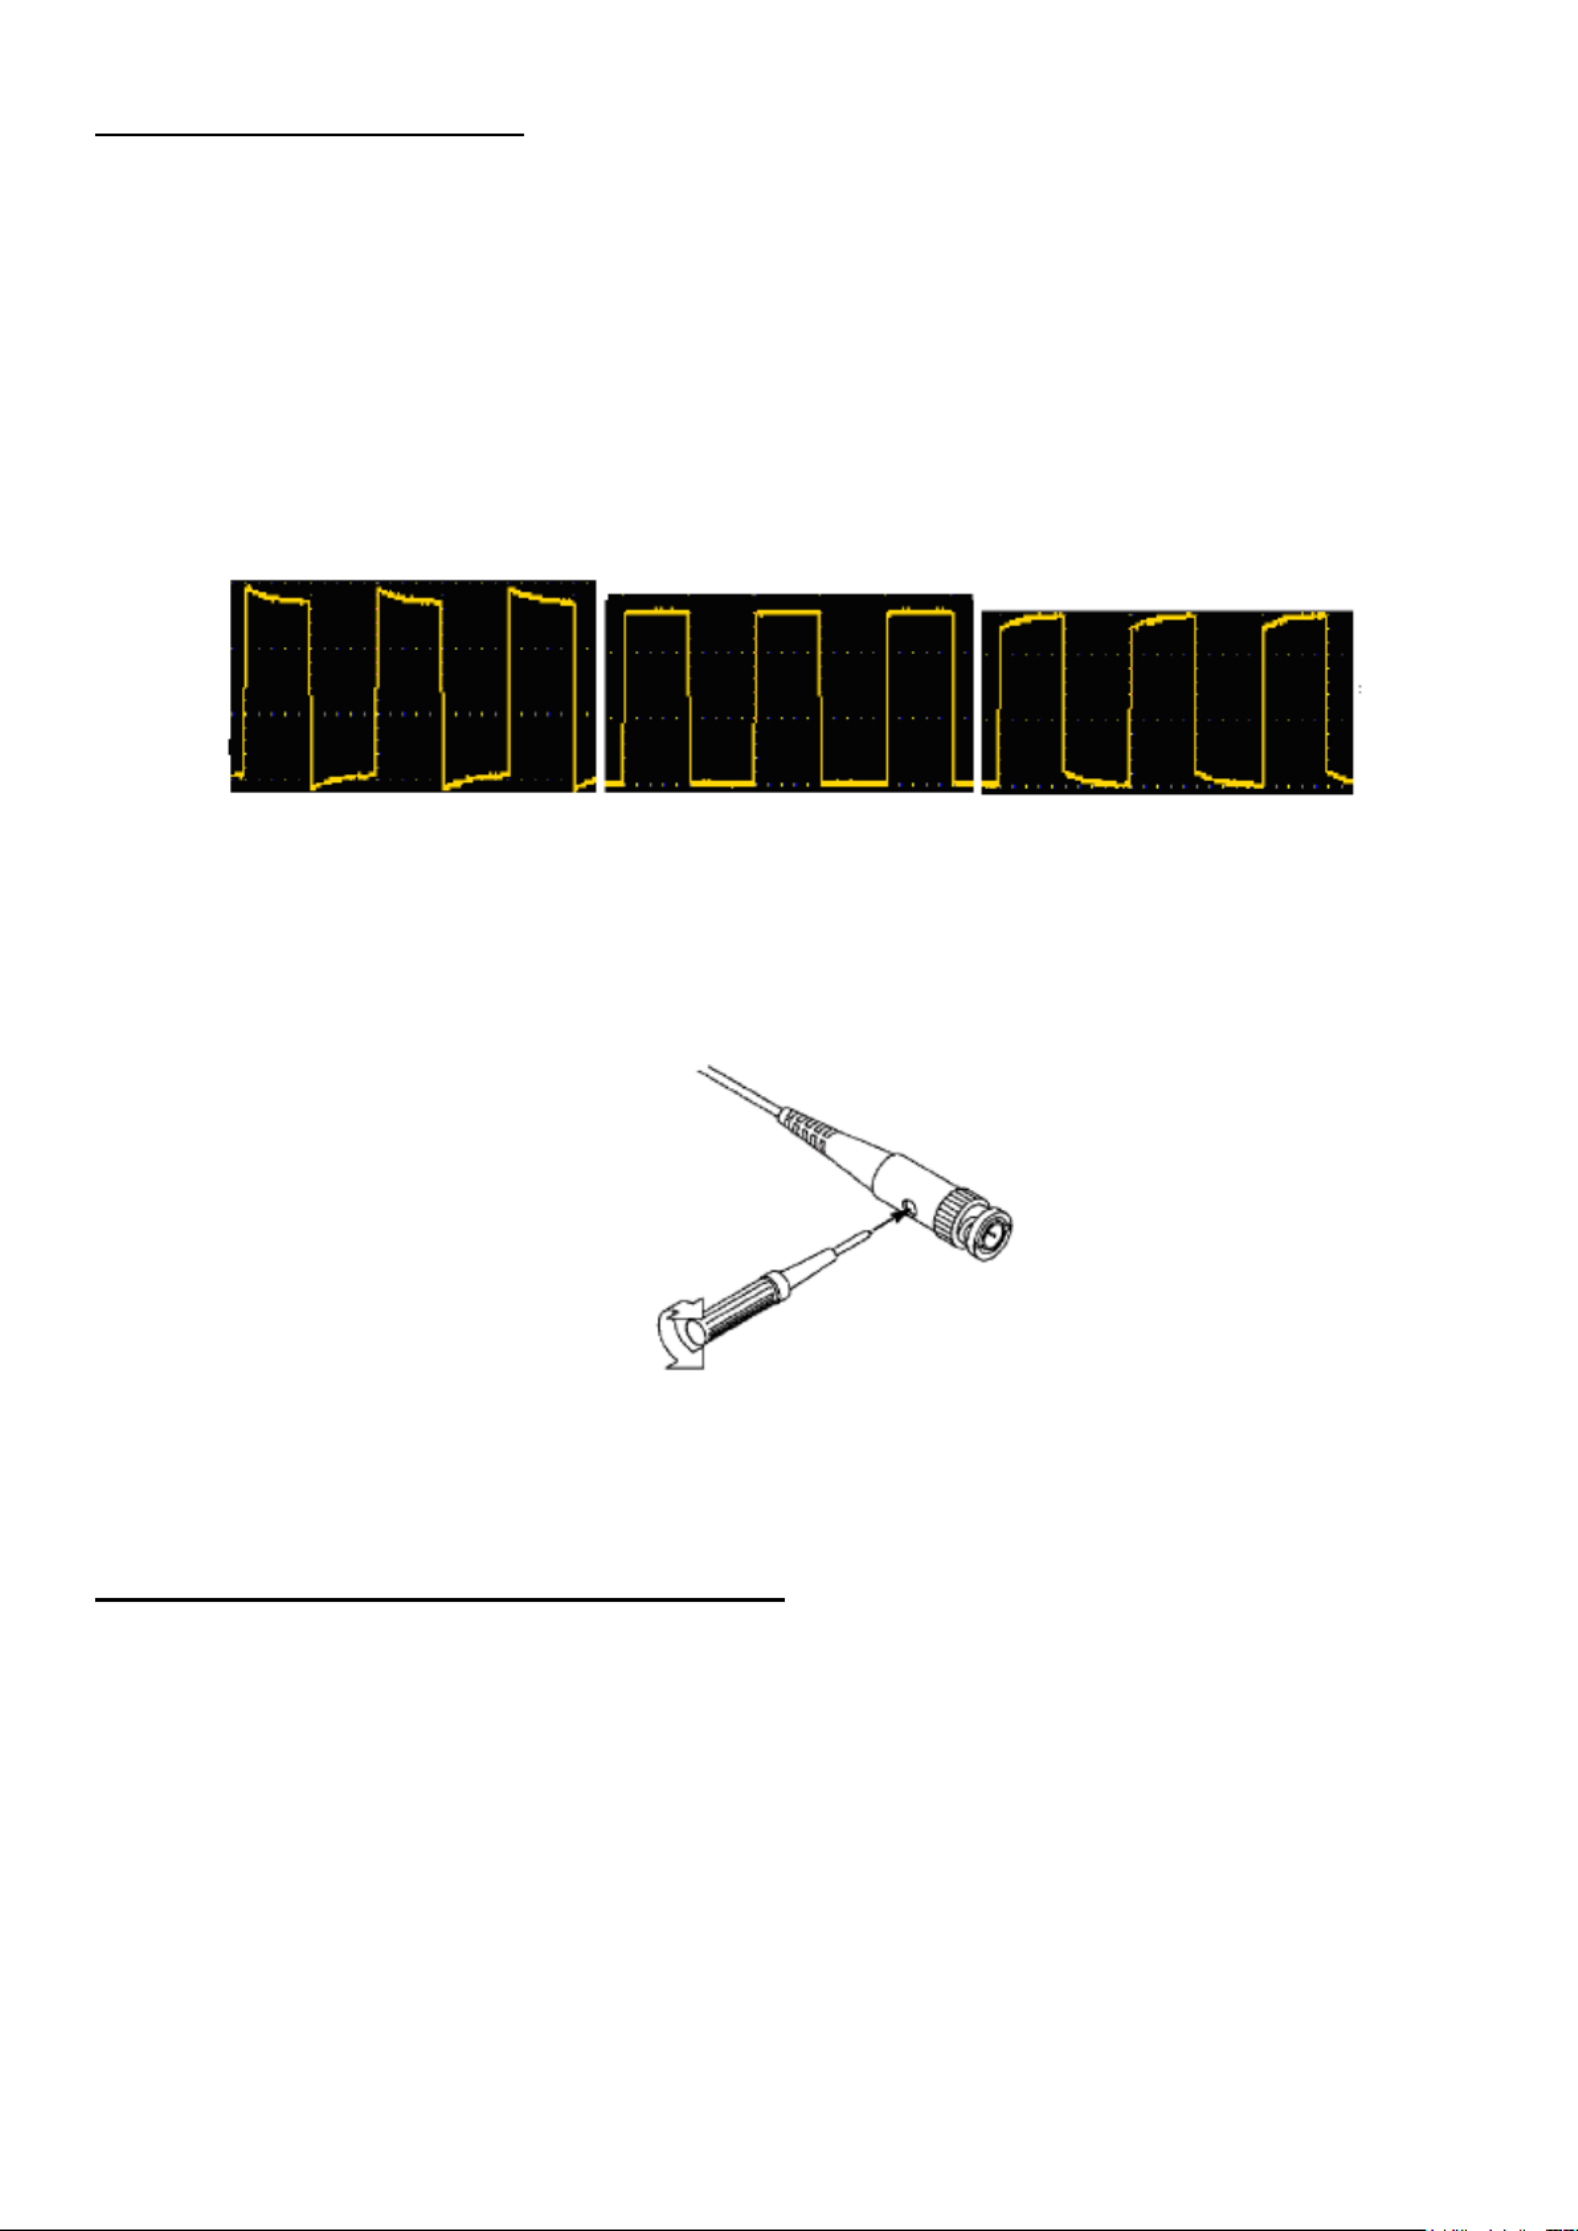
5.2 Probe compensation
The first time you connect the probe to an input channel, you must match the probe to the input
channel. A probe that is not or incorrectly compensated results in measurement errors. Perform
the probe compensation as follows:
1. Set the attenuation factor of the probe to 10X in the menu, set the switch on the probe to 10X
and connect the probe to channel 1. When using the hook tip, make sure it stays securely
attached to the probe. Connect the probe tip to the signal connector of the probe compensator
and connect the terminal of the reference cable to the ground terminal of the probe
compensator; then press the AUTOSET button.
2. Check the displayed waveforms and adjust the probe until correct compensation is achieved
Overcompensated Correct compensation Undercompensated
Abbildung 3.1 Tastkopfkompensation
3. Repeat the procedure if necessary in order to obtain an image that is as even as possible.
5.3 Setting the probe attenuation factor
The probe has several probe attenuation factors that affect the oscilloscope's vertical scale factor.
If the setted probe attenuation factor should be changed or checked, press the key for the function
menu of the respective channel and then the selection key corresponding to the probe until the
correct value is displayed.
- - 16
This setting remains in effect until it is changed again.
Note: The attenuation factor of the probe is in the menu presetted to 10x.
Make sure that the value set on the probe's attenuation switch corresponds to the
attenuation value set on the oscilloscope.
The values that can be set with the switch on the probe are 1X and 10X (see picture).
Note: When the attenuation switch is set to 1X, the probe limits the bandwidth of the
oscilloscope to 5 MHz. You need to set the switch to 10X if you want to take
advantage of the full bandwidth of the oscilloscope.
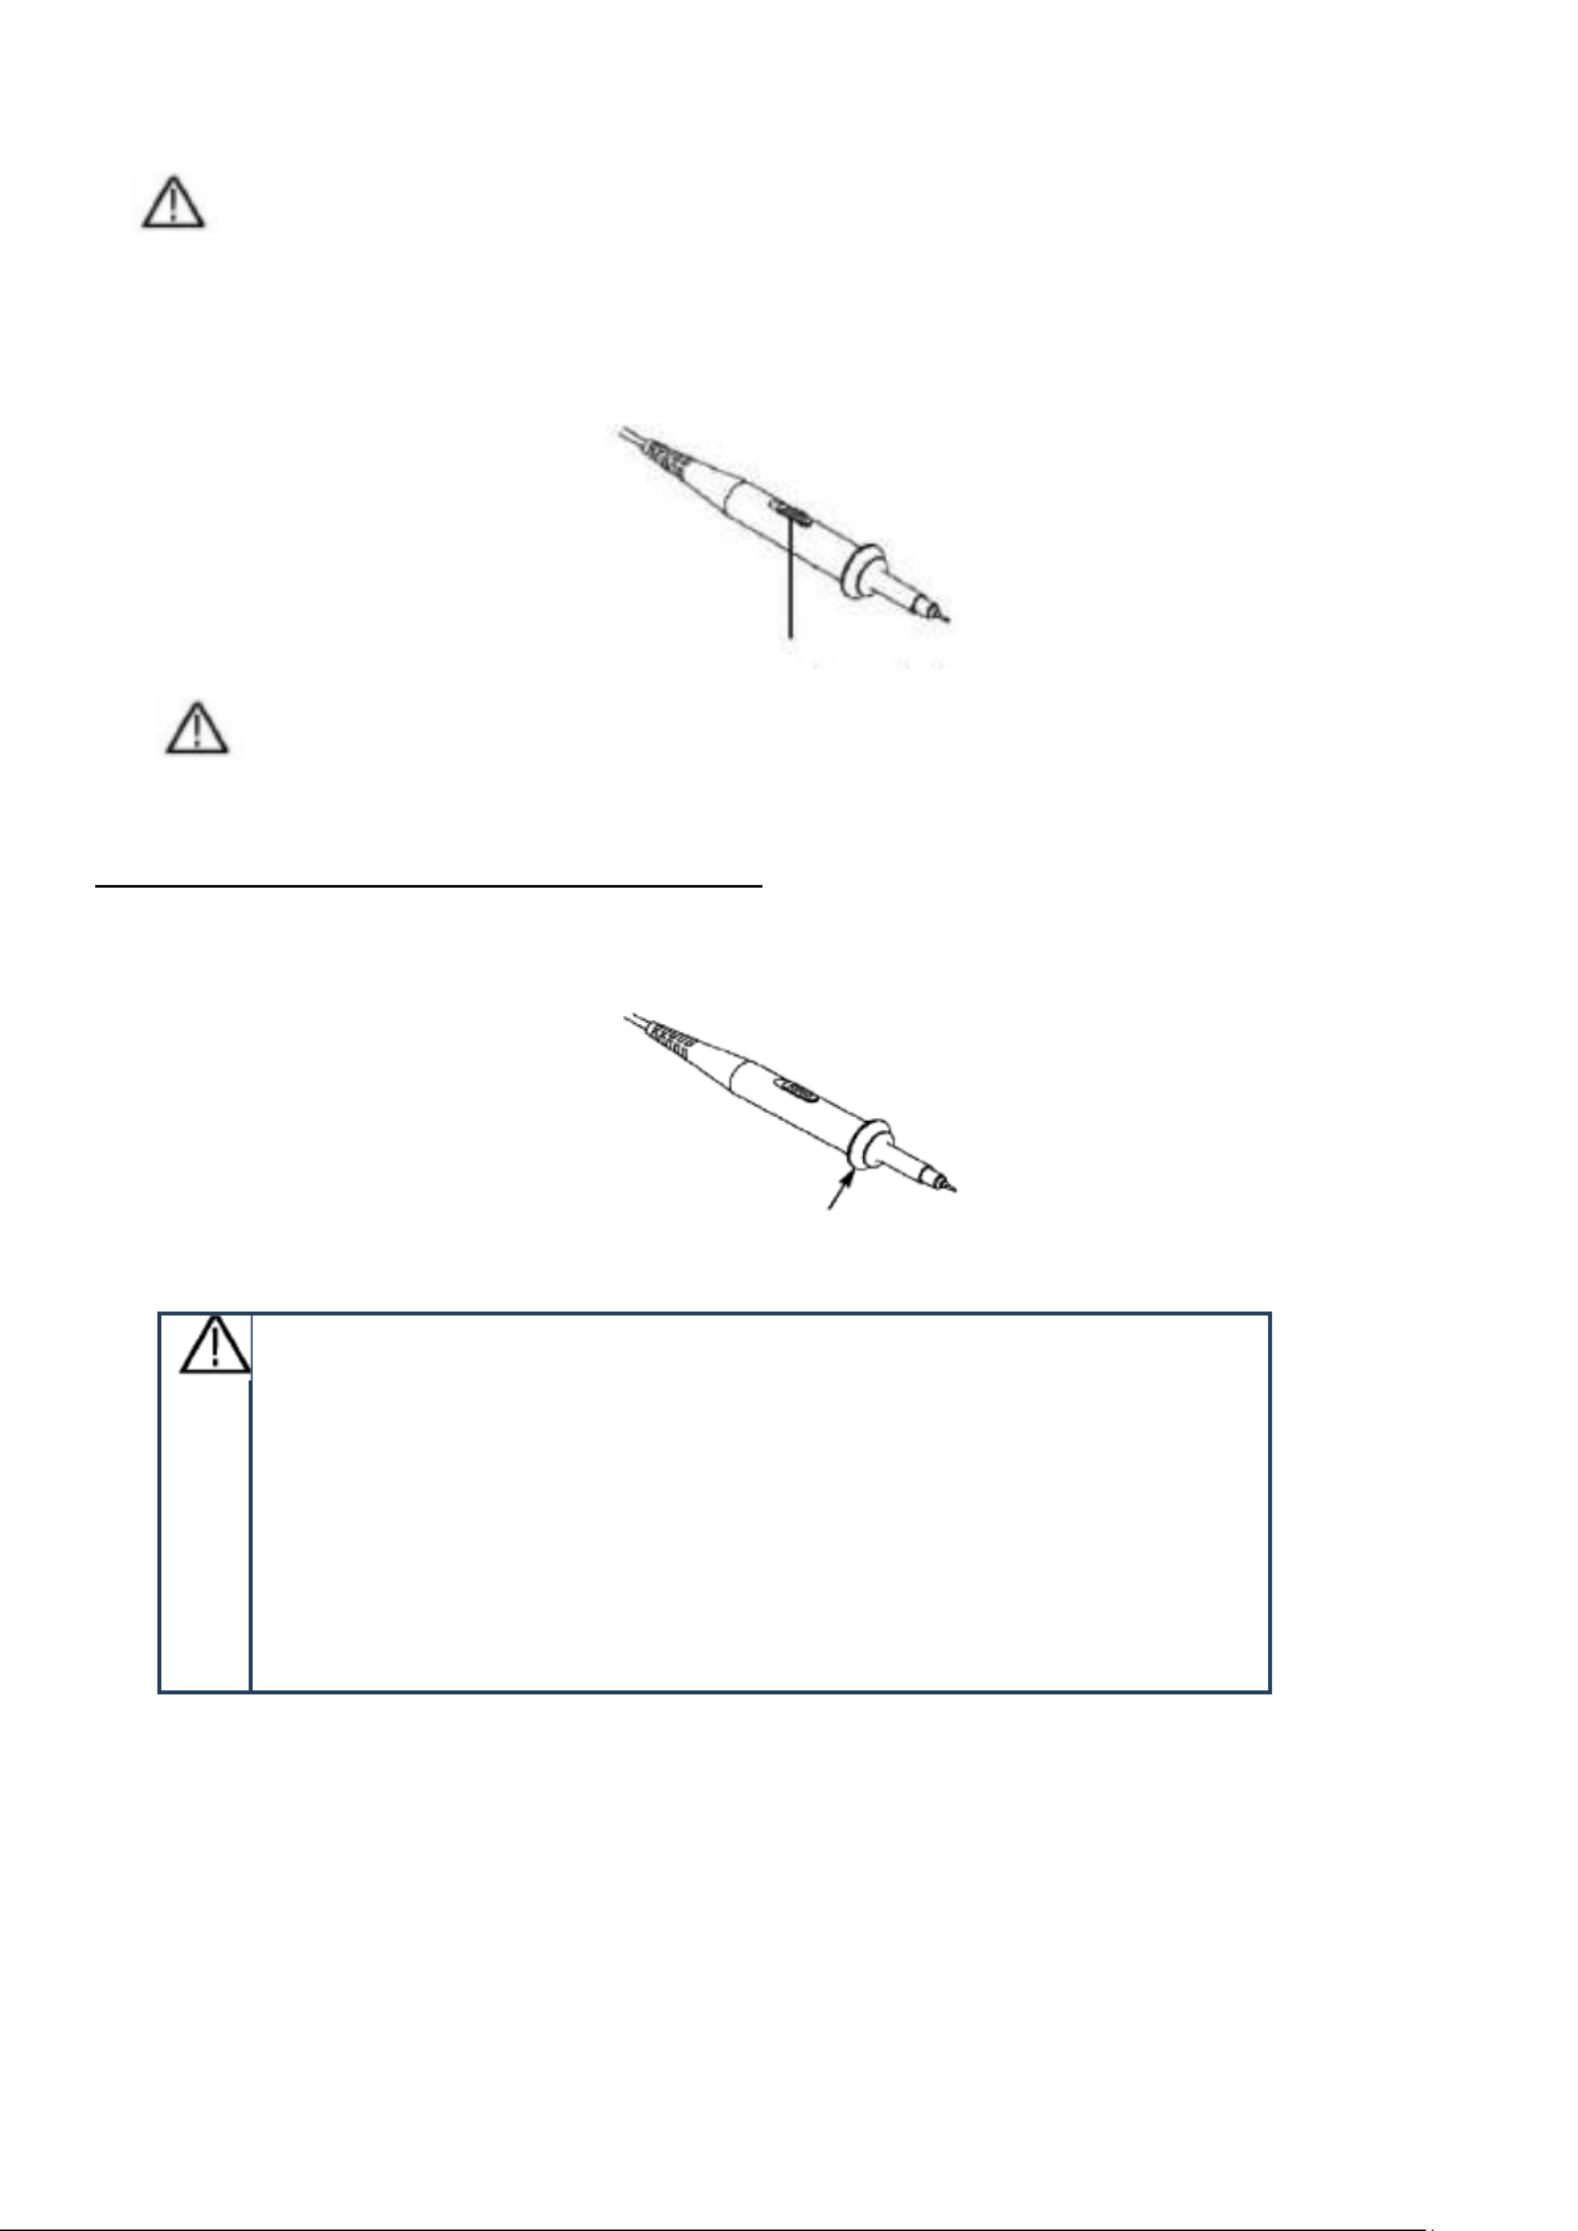
Safety instrucstion for using the probe head
The protective ring around the probe head handle prevents unintentional reaching over or slipping
and thus contact with any metal parts that may be live (see error! Reference source could not be
found).
Handle protection
Warning:
To avoid electric shock, you should always keep your fingers behind
the safety ring on the probe.
To protect you from electric shock, do not touch any conductive metal
part of the probe tip when it is connected to a power source.
Before any measurements are carried out, always first connect the
probe to the oscilloscope and then the earth terminal to the housing of
the device under test.
- - 17
5.4 Self - calibration
With the auto-calibration, the oscilloscope can be quickly put in the optimal state for high-precision
measurements. You can run this program at any time, but you must do it if the ambient
temperature varies by more than 5 ° C. Remove all probes and cables from the input jacks before
performing the auto calibration. Press the Utilitysymbol, press the “ ” button, then press the
Function area and then press “ ”, finally press SelfCal. A window now appears which asks Adjust
you to press the SelfCal button again to start the self-calibration.
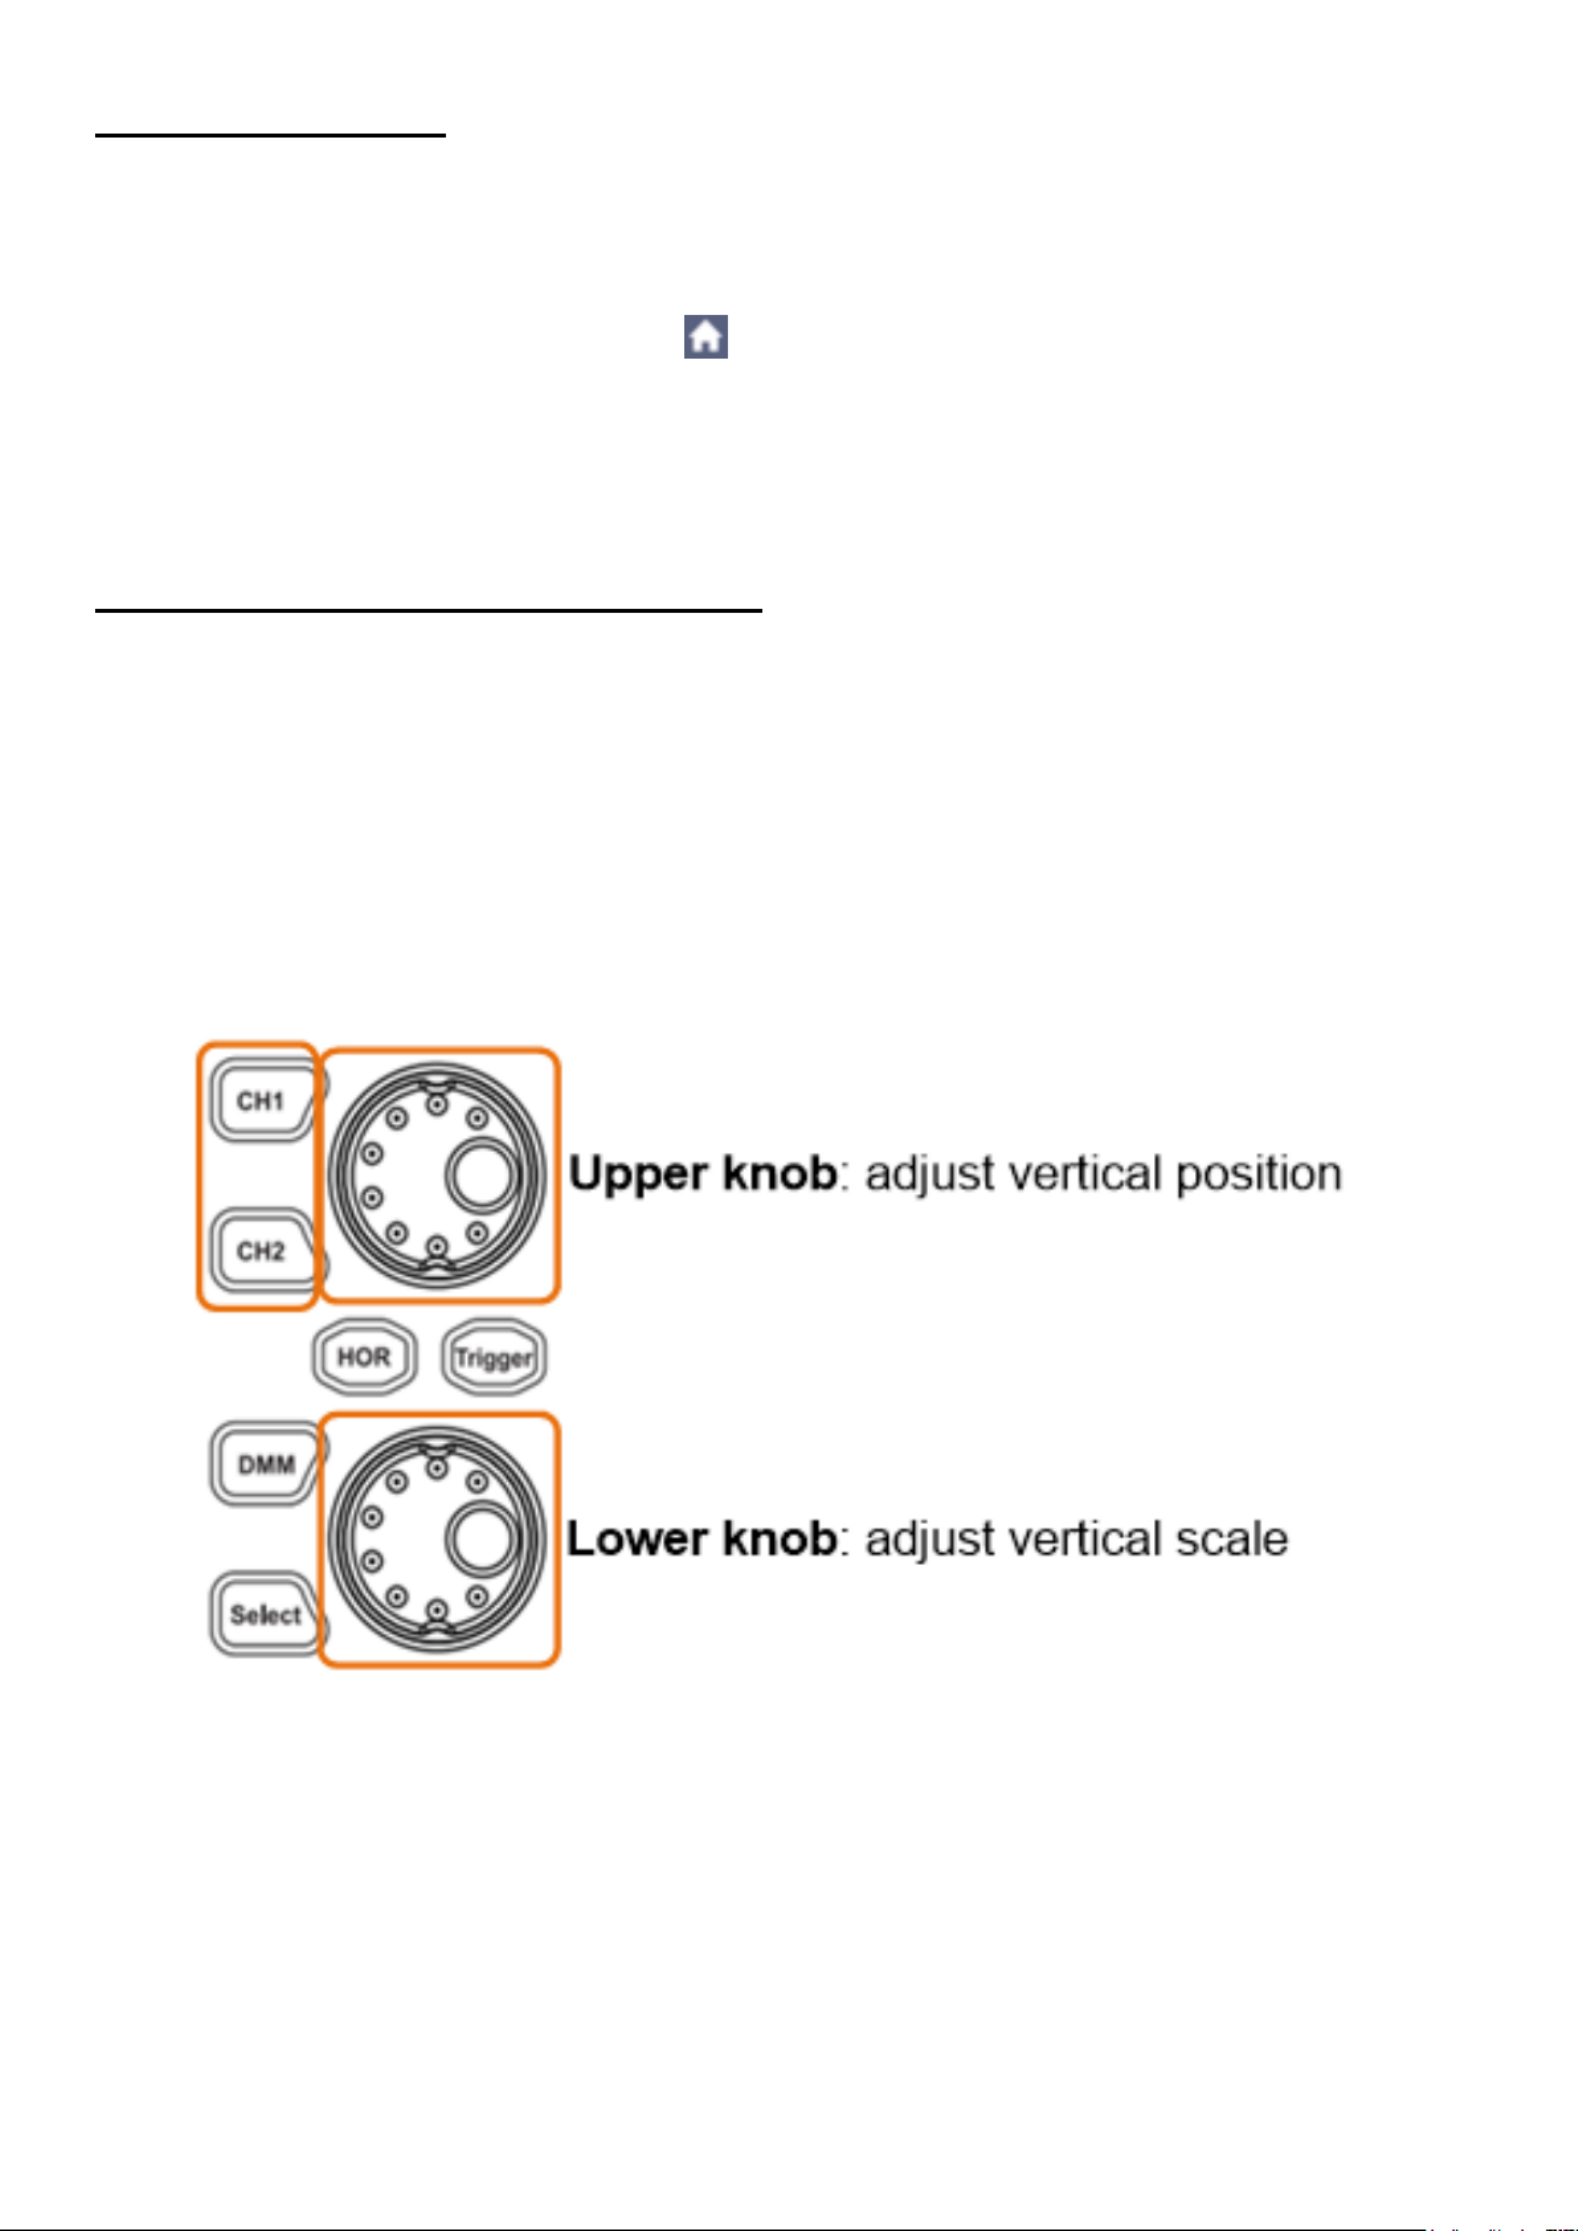
5.5 Introduction to the vertical system
As shown in Figure 3.2, there are some buttons and buttons in the vertical control elements that
are used to operate the oscilloscope.
Press one of the channel buttons CH1 or CH2 to open the corresponding channel menu. To
deselect the channel, press the button again.
If you want to adjust the vertical position and the vertical scaling of a channel, first press the
corresponding channel button to select the desired channel.
Now use the rotary knobs to set the vertical position or the vertical scaling of the channel.
Figure 3.2 Setting the vertical parameters
- - 18
1. Press the control panel button CH1 or CH2 to select the desired channel
2. When one of the channel buttons is lit, you can use the upper knob to display the selected
channel waveform in the center of the waveform window. The top knob controls the vertical
display position of the selected channel waveform. When the top knob is turned, the pointer
of the grounding point of the selected channel is moved to move up and down the
waveform and the position report in the center of the screen changes accordingly.
3. You can change the vertical scale setting. You can read the resulting status information on
the display. Use the information in the status bar at the bottom of the waveform window to
determine the vertical scaling factor of the channel. Turn the lower knob and change the
"Vertical Scaling Factor (Voltage Division)" of the selected channel. The display shows that
the scaling factor of the selected channel has been changed accordingly in the status bar
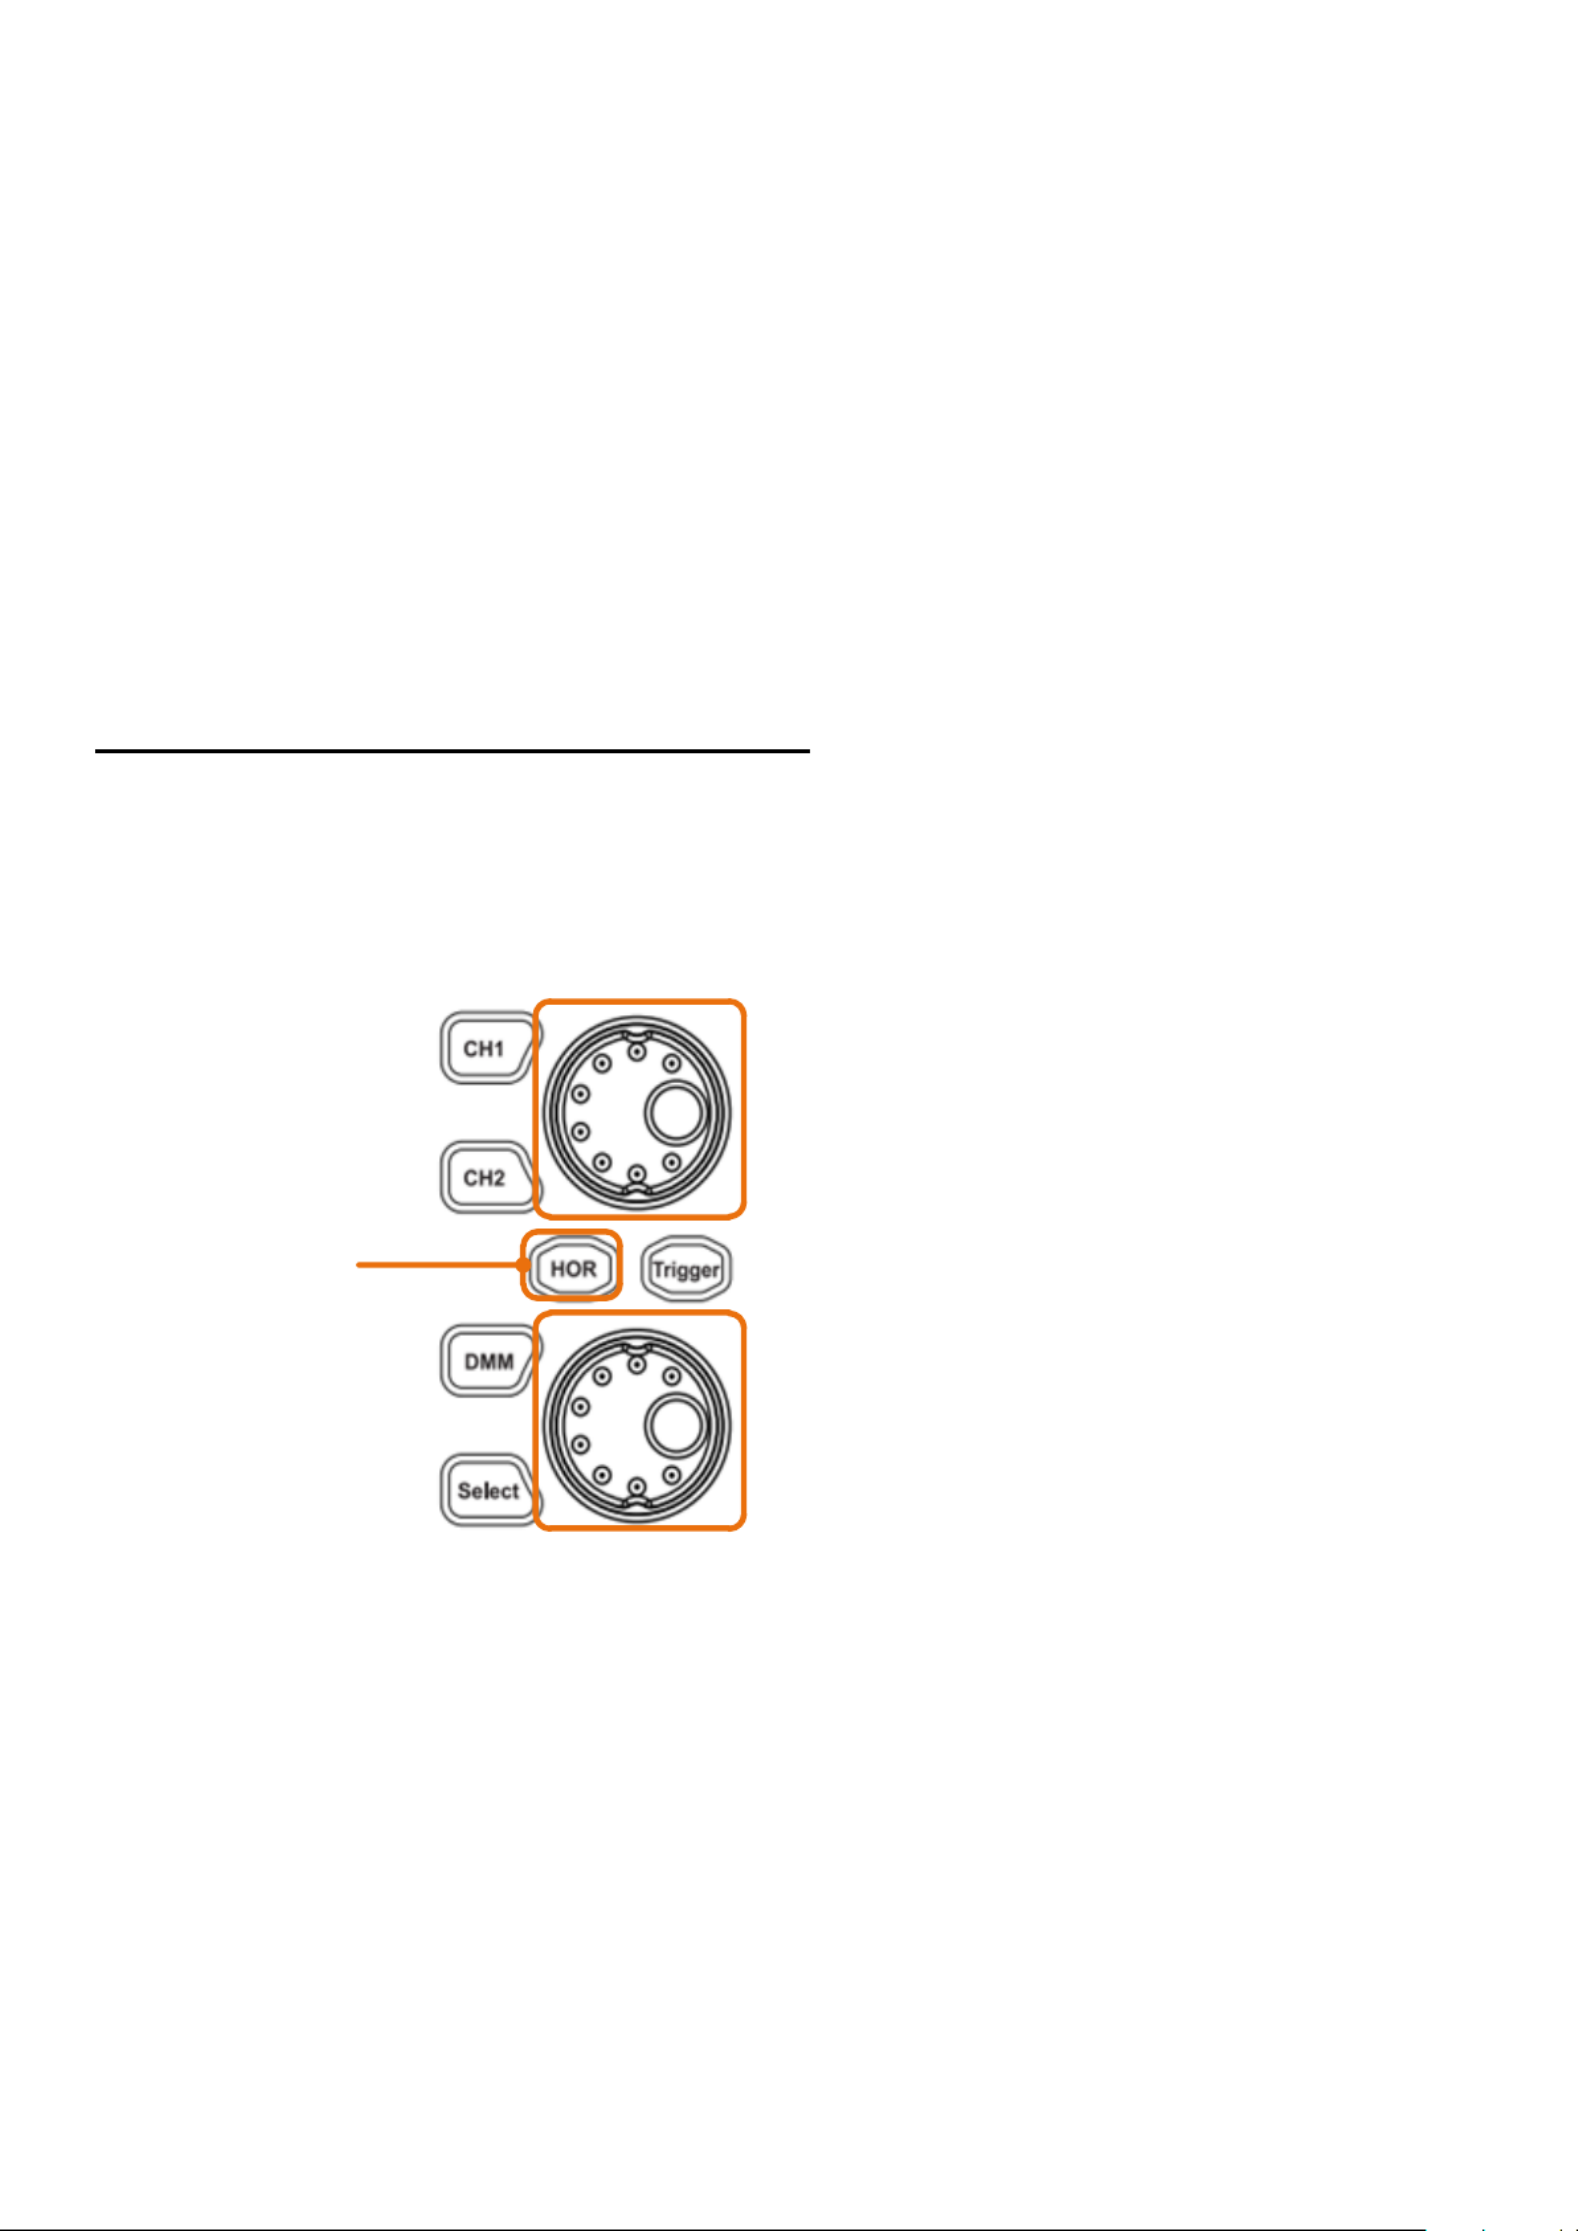
5.6 Introduction the horizontal systemto
As shown in Figure 3.3, there is a button and two buttons in the horizontal control elements, which
are used to operate the oscilloscope. The following steps explain how the horizontal settings are
made.
Figure 3.3 Setting the horizontal parameters
Upper knob: adjust horizontal position
When the HOR
button is lit
Lower knob: adjust horizontal scale
- - 19
1. With the HOR button lit, press the HOR button to toggle between normal mode and
wave zoom mode.
2. With the HOR button lit, rotate the lower knob to change the horizontal timebase
setting and observe the resulting change in status information. Rotate the lower knob
to change the horizontal time base. It can be seen that the horizontal time base
displayed in the status bar changes accordingly.
3. When the HOR button is lit, use the upper knob to adjust the horizontal position of
the signal in the waveform window. The upper button is used to control the trigger
offset of the signal or for other special applications. When used to trigger the shift,
the waveform can be observed to move horizontally as the top knob is turned. By
pressing the upper rotary knob, it is possible to reset the set offset to 0.
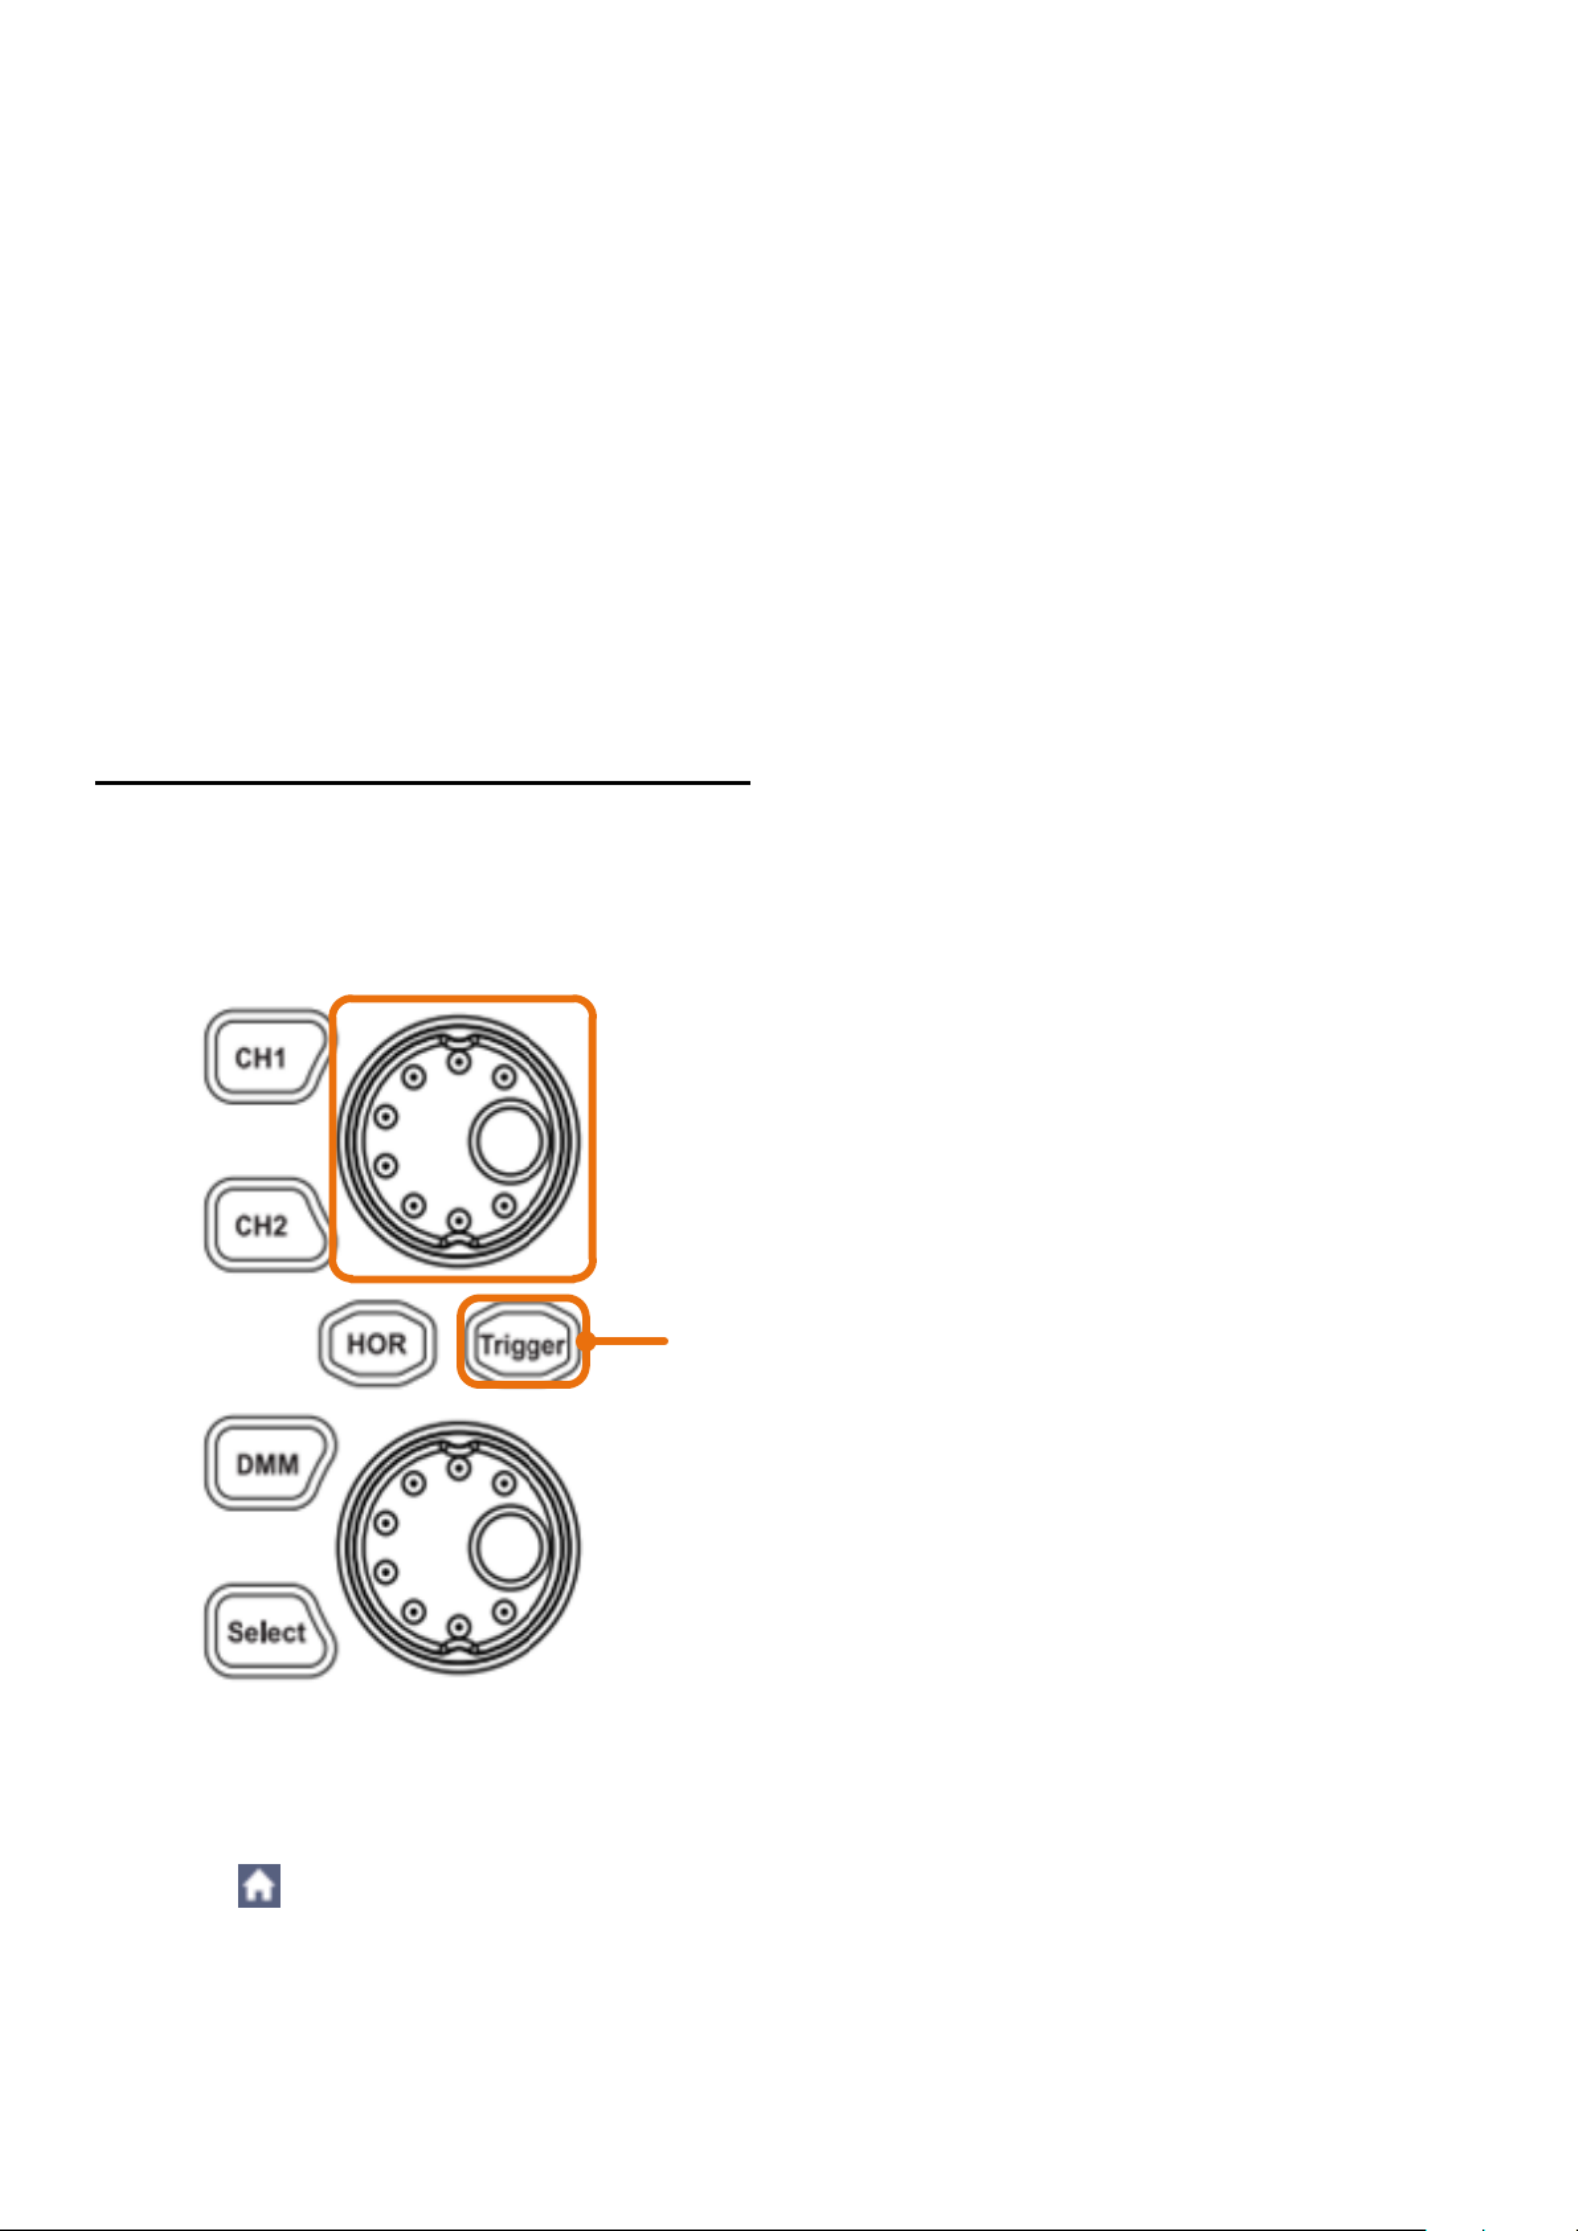
5.7 Introduction to the trigger system
As shown in Figure 3.4, it is possible to manage the trigger control using a button and a rotary
knob. The following steps explain how the trigger settings are made.
Figure 3.4 Setting the trigger
Press the symbol and open the trigger menu. In this submenu it is possible to adjust the signal
by setting the trigger for the display.
Upper knob: adjust trigger level
When the Trigger button is lit
- - 20
Press repeatedly to
switch the options
Click to increase the
value of cursor position
Move the cursor
Click to decrease the
value of cursor position
1. Press the symbol and open the trigger menu. In this submenu it is possible to
adjust the signal by setting the trigger for the display.
2. To set the trigger, press the trigger button that it lights up. You are now able to adjust
the trigger level of the previously selected channel using the upper rotary knob for
the required display.
5.8 Introduction to the touchscreen operation
The oscilloscope can be controlled and adjusted using the push buttons and rotary knobs. But it is
also possible to make the respective setting using the touchscreen.
A symbol is permanently displayed in the upper right corner of the display, which shows whether
the touchscreen is locked or available ( ). When the lock is open, you can adjust the or
settings using the touchscreen. When it is closed, no settings can be made via the touchscreen.
Briefly press the symbol to lock or unlock the touchscreen.
The following explains each of the oscilloscope displays:
5.8.1 Change menu
To change menu options, press the area of the menu item to be changed. Touch the
corresponding key to switch, see Figure 3.5:
Figure 3.5 Menu options
5.8.2 Value setting in the menu
use the crosshairs to set the desired measuring rate of the measured value (Figure 3.6):
Figure 3.6 Cursor for setting the measuring rate
- - 21
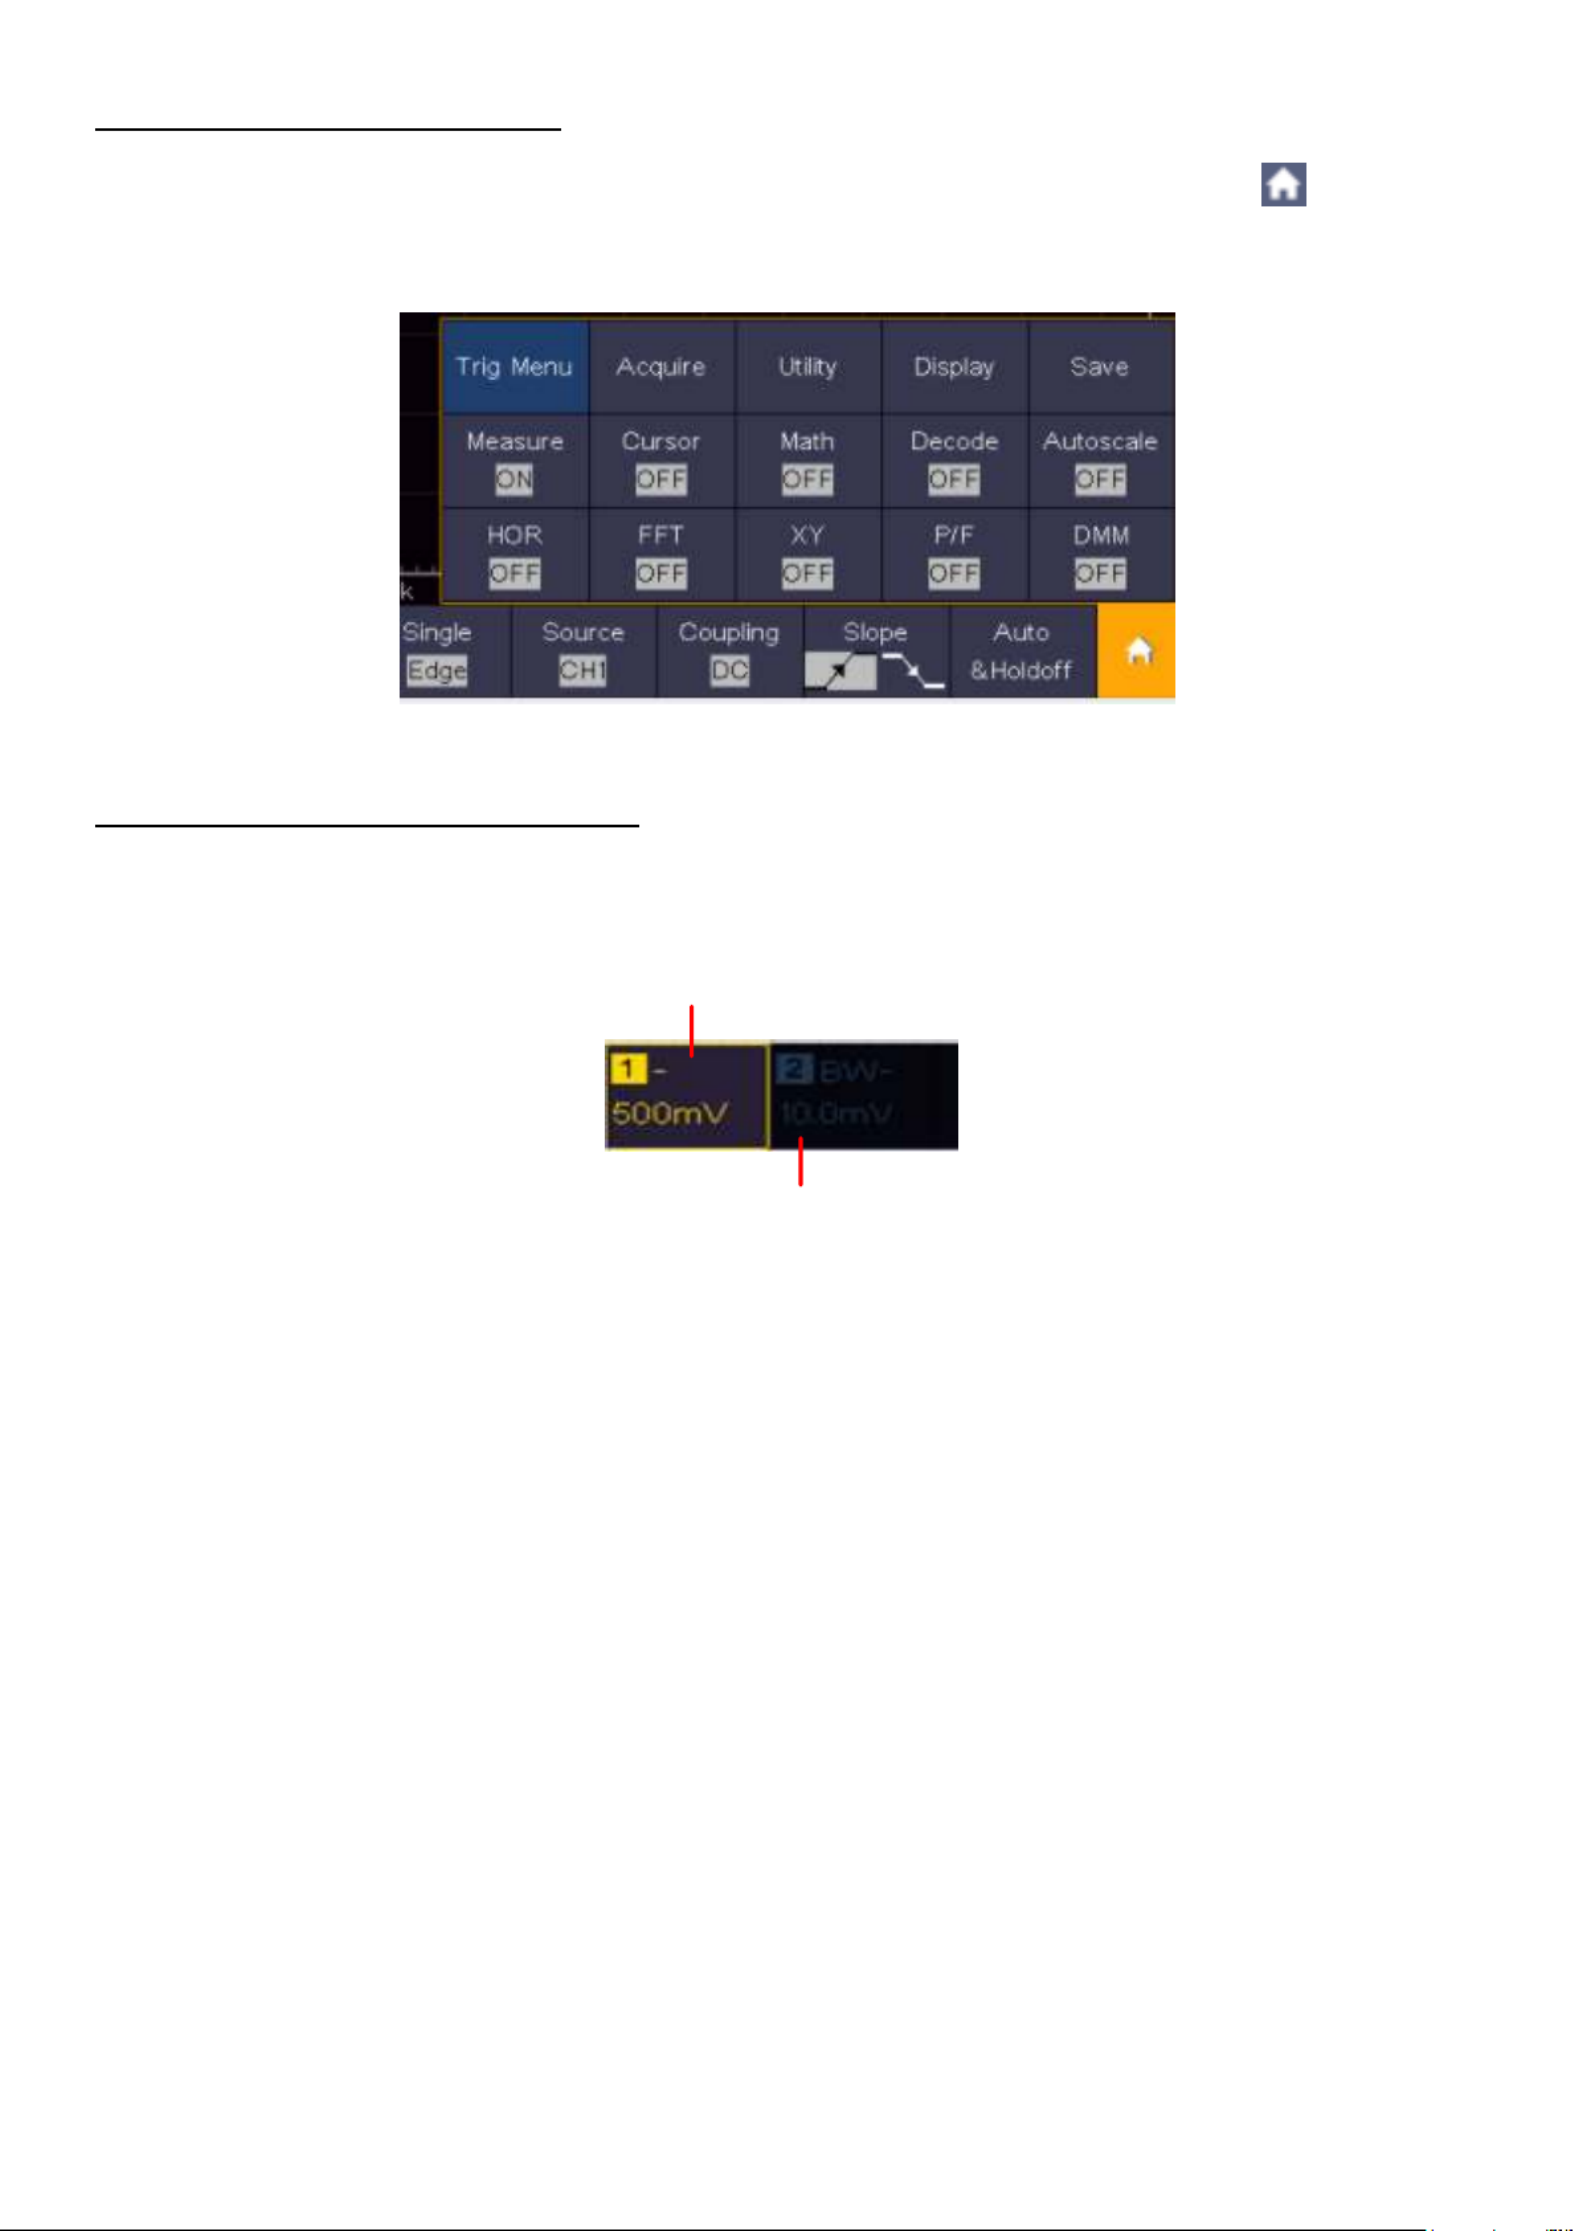
5.8.3 Calling up the main menu
To call up the main menu, press the symbol in the lower right corner of the screen ( ). The menu
is shown in Figure 3.7.
Figure 3.7 Main menu
5.8.4 Selection of the active channel
The available channels are displayed in the lower left corner. By activating the respective channels
it is possible to activate or deactivate them. Each active channel is illuminated on the button.
When a channel is deactivated, the associated button is darkened (see Figure 3.8).
Channel is off
Channel is on and selected
Figure 3.8 Display of the channels
- - 22
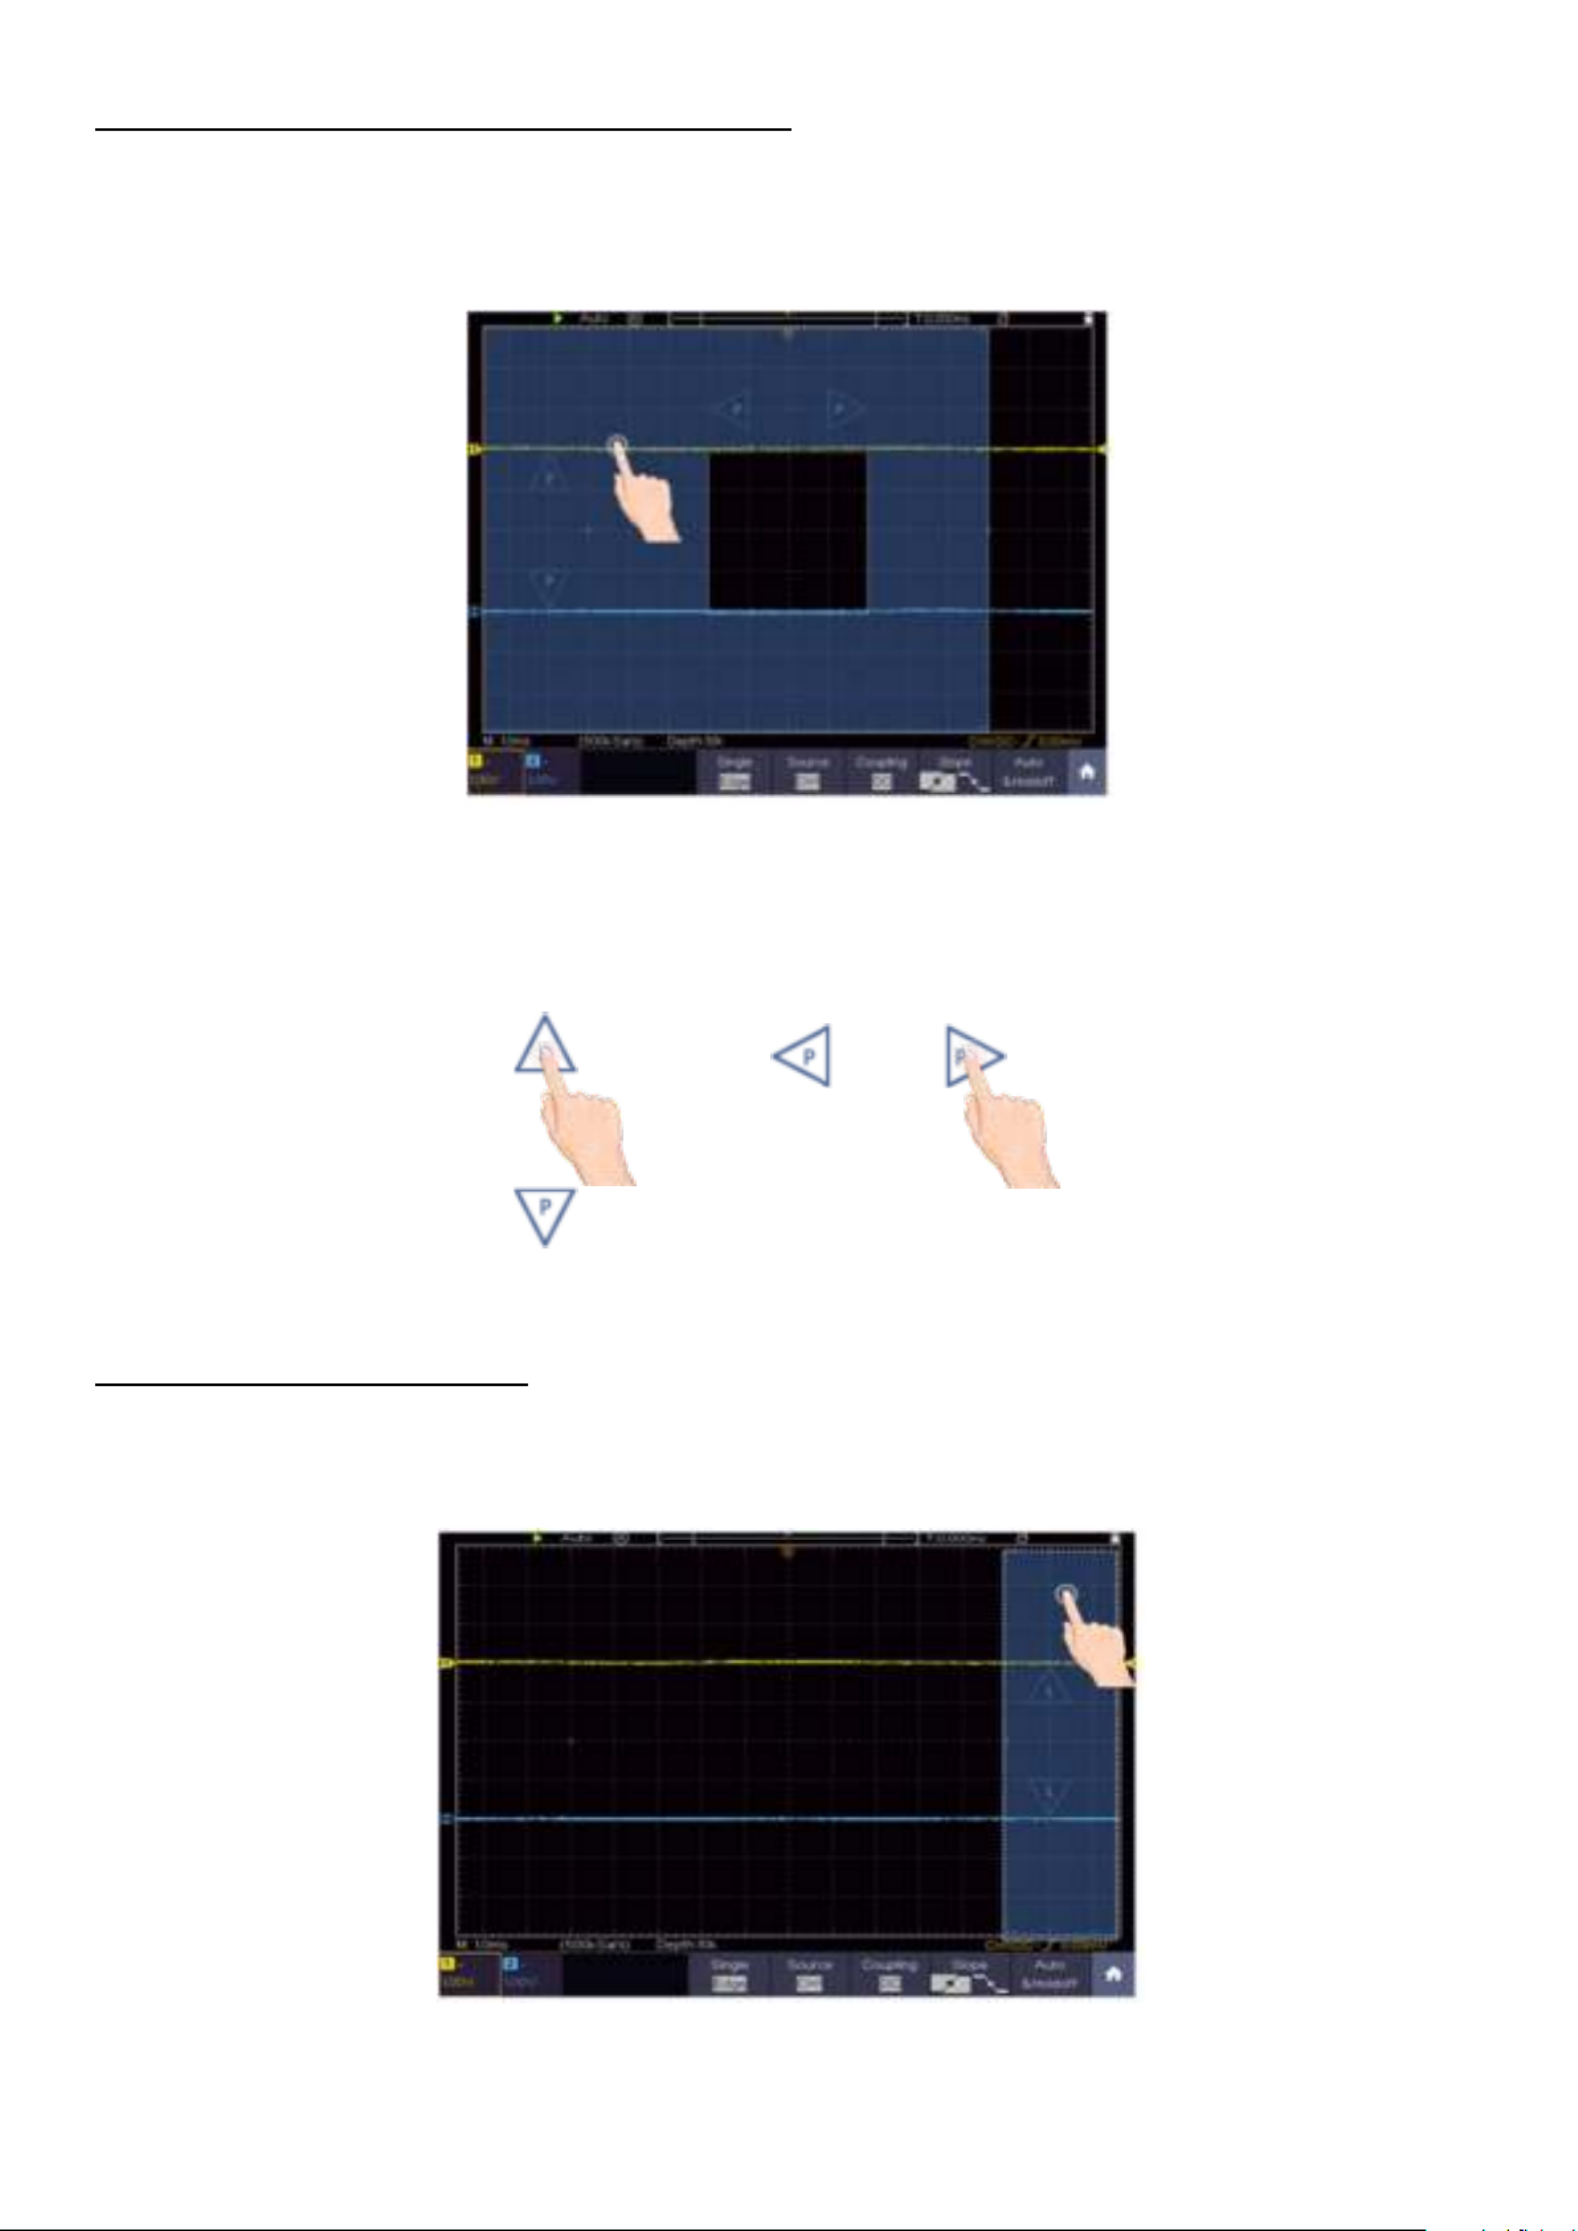
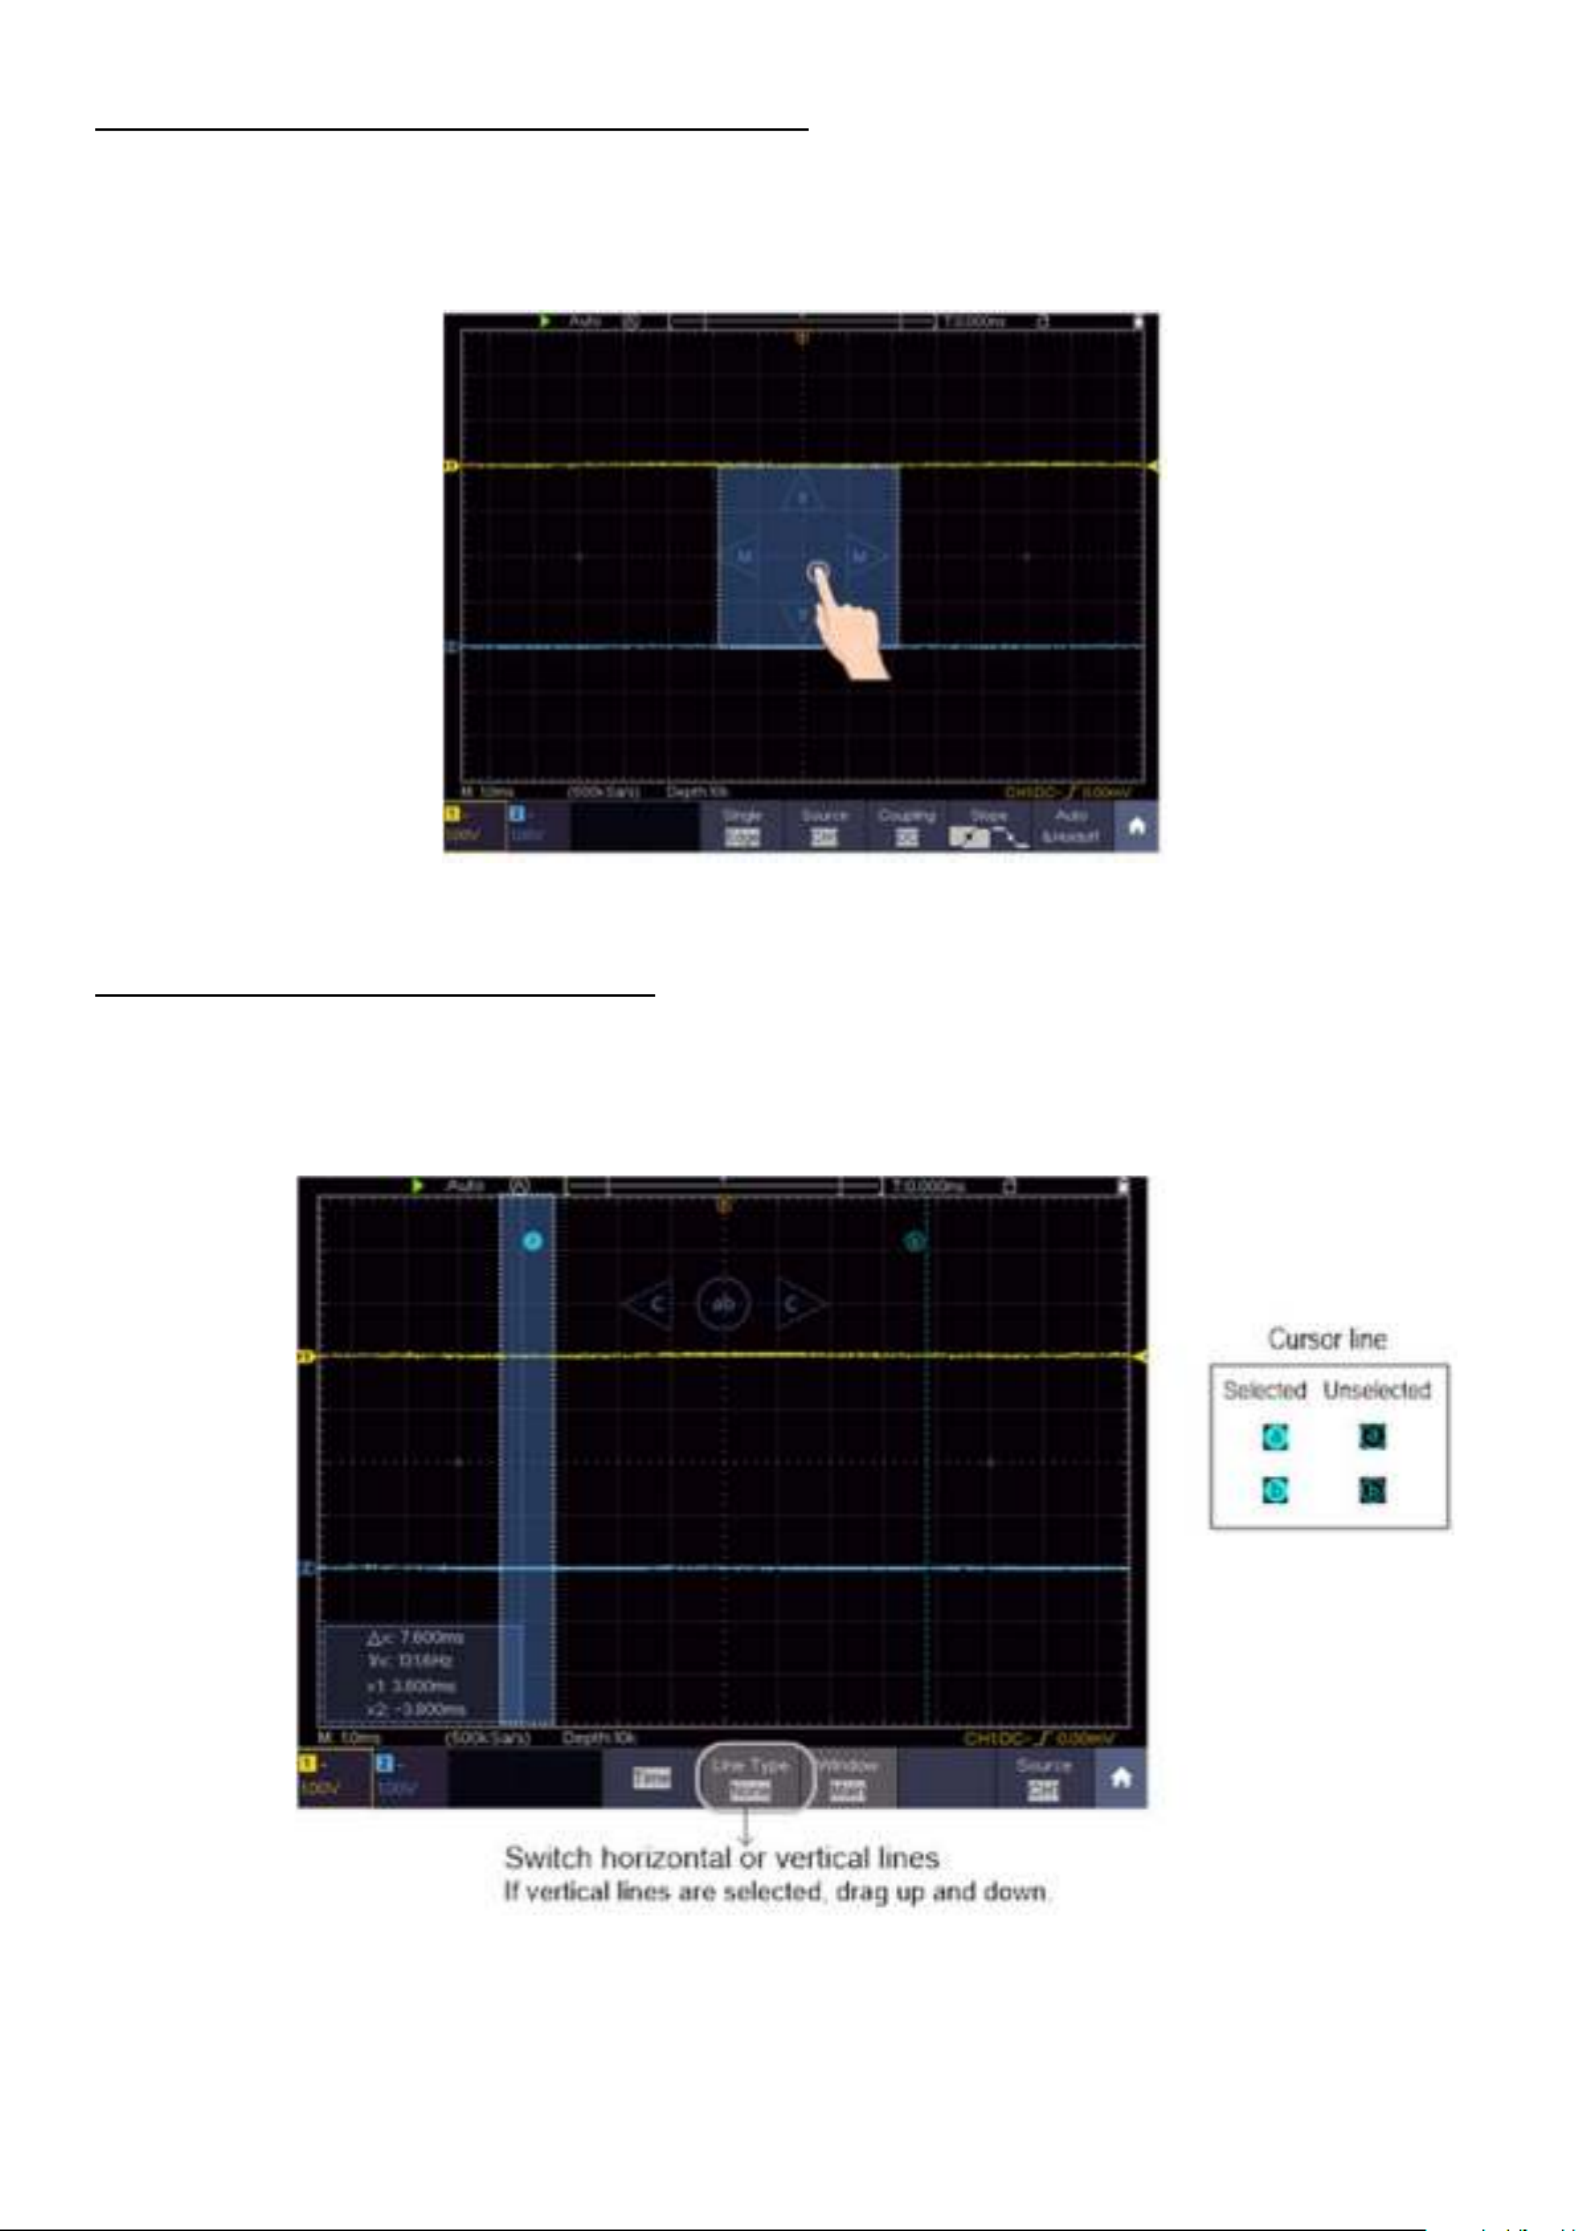
5.8 Adjustment of the horizontal and vertical .5
By simply pressing the touchscreen on the left-hand side, the arrow keys appear for setting the
horizontal and vertical of the selected channel. By pressing the free area of the touchscreen again,
the arrows are hidden. In order to be able to make fine adjustments, press directly on the P in the
arrow.
Figure 3.9 Adjustment of the horizontal and vertical
To make fine adjustments, press the P in the arrow directly (see Figure 3.10)
Figure 3.10 Fine adjustment
5.8.6 Setting the trigger level
To adjust the trigger level of the channel, press the free area on the right of the touchscreen. Two
arrows appear with which you are now able to change the trigger value (see Figure 3.11).
Figure 3.11 Setting the trigger
- - 23
5.8.7 Setting the time base and voltage division
To set the time base and the voltage division using the touchscreen, press in the middle of the
touchscreen and arrows appear for setting the values. The time base or the voltage division is set
by simply pressing the arrows (see Figure 3.12).
Figure 3.12 Time base and voltage divider
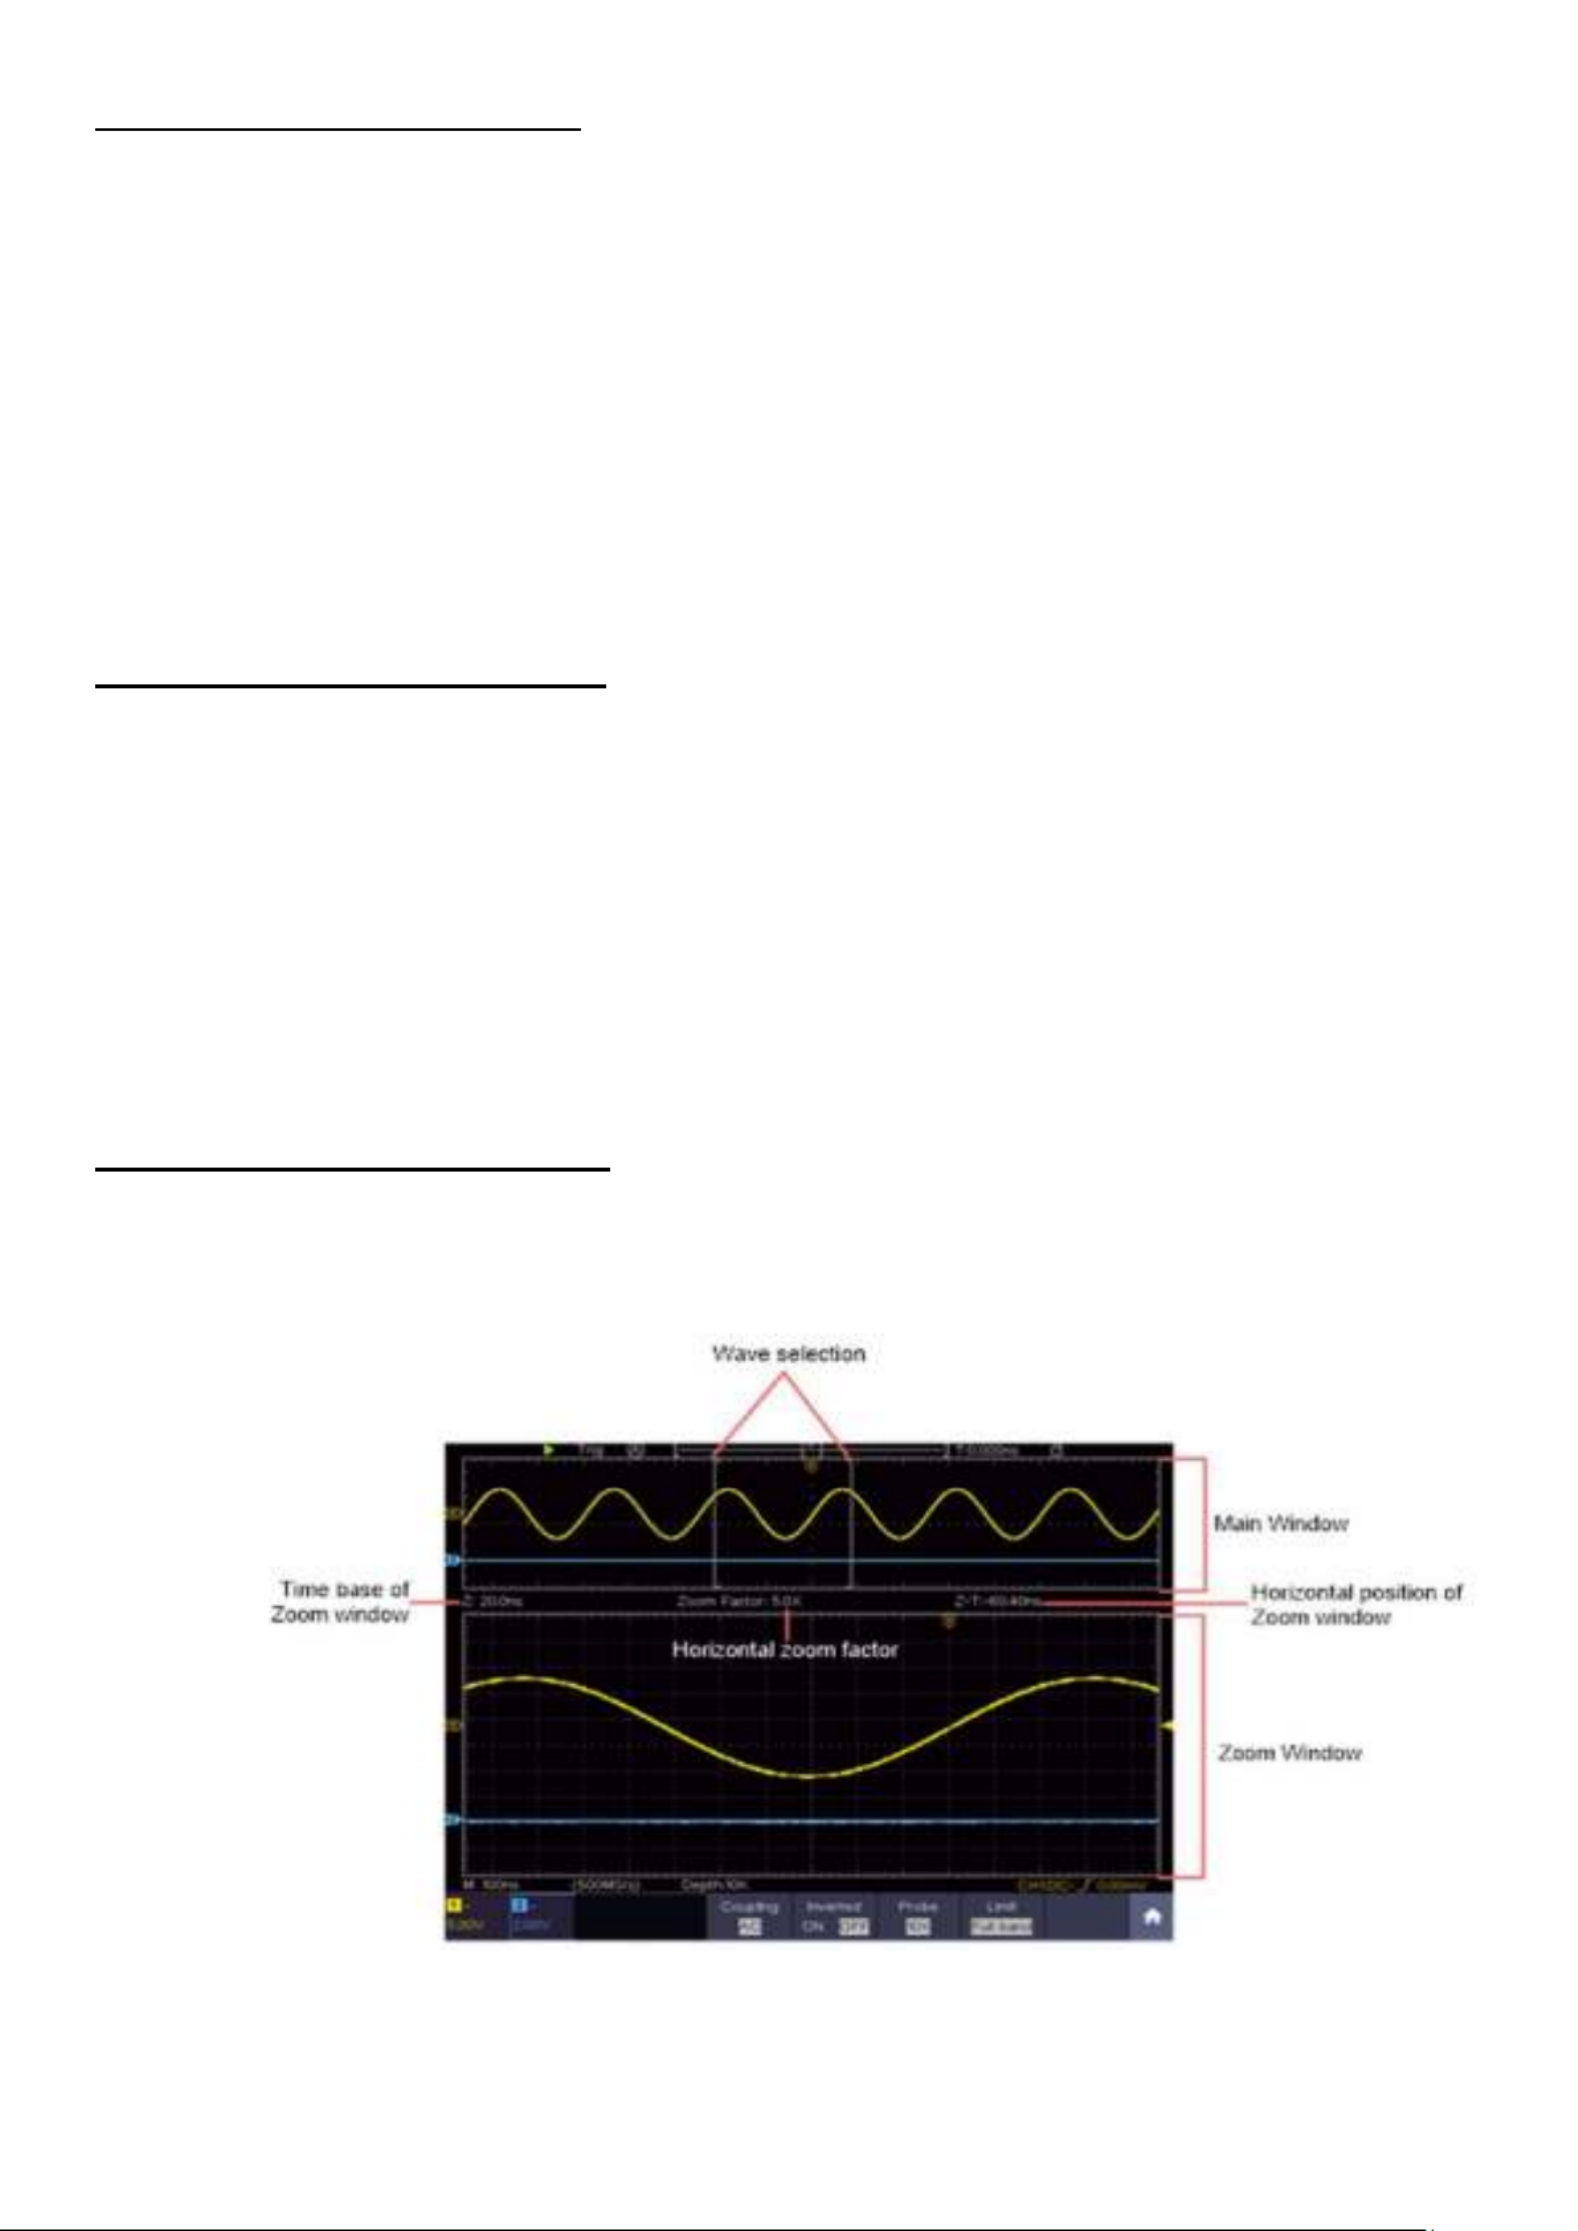
5.8.8 Measurements using the cursor
You are able to determine a recorded current value with the cursor. To do this, press the menu
key (see Accessing the main menu) and switch on the cursor. Now, as in Figure 3.13, the option of
setting two cursor lines to the measured value appears.
Figure 3.13 Measurements using the cursor

- - 24
6. User Instructions (for advanced users)
In the previous paragraphs, the user has already been familiarized with the basic functions of the
functional areas, buttons and knobs of the oscilloscope. Based on the introduction of the previous
chapters, the user should already have gained initial knowledge about changing the oscilloscope
settings, selecting and evaluating the status bars and general operation.
The following chapters cover the following subject areas:
Set the vertical system
Set the horizontal system
Set the trigger system
Carry out sampling settings
Implementation oft he auxiliary system
Set the display system
Save and recall waveforms
Record and playback waveforms
Clone and recall a waveform
Supporting system settings
Perform automatic measurements
Setting of automatic measurements
Perform cursor measurements
Using the math function
Use the autoscale function
Use the ececuting buttons
It is recommended that you read this chapter carefully in order to be able to use the various
measurement functions and other operating methods of the touchscreen oscilloscopes.

- - 25
6.1 Set the vertical system
The VERTICAL functions include 2 menu buttons such as CH1 CH2 (2CH models) and CH1 ~ ~
CH 4 (4 CH Models) as well as 2 rotary controls for vertical and horizontal setting, to be set for
each measuring channel.
Settings CH1 ~
~
~
~~ ~
~
~
~~ CH2, CH1 CH4
Each channel has an independent vertical menu with functions based on this channel.
Activate / deactivate waveform display
Pressing the CH1 CH2, CH1 CH4 buttons has the following effect: ~ ~
• If the waveform is switched off, it is switched on and the channel menu is displayed.
• If the waveform is already switched on, the channel menu is also displayed.
• If the waveform is already switched on and the channel menu is displayed, switch the waveform
and the channel menu off again with this action
Function
menu
Settings
Description
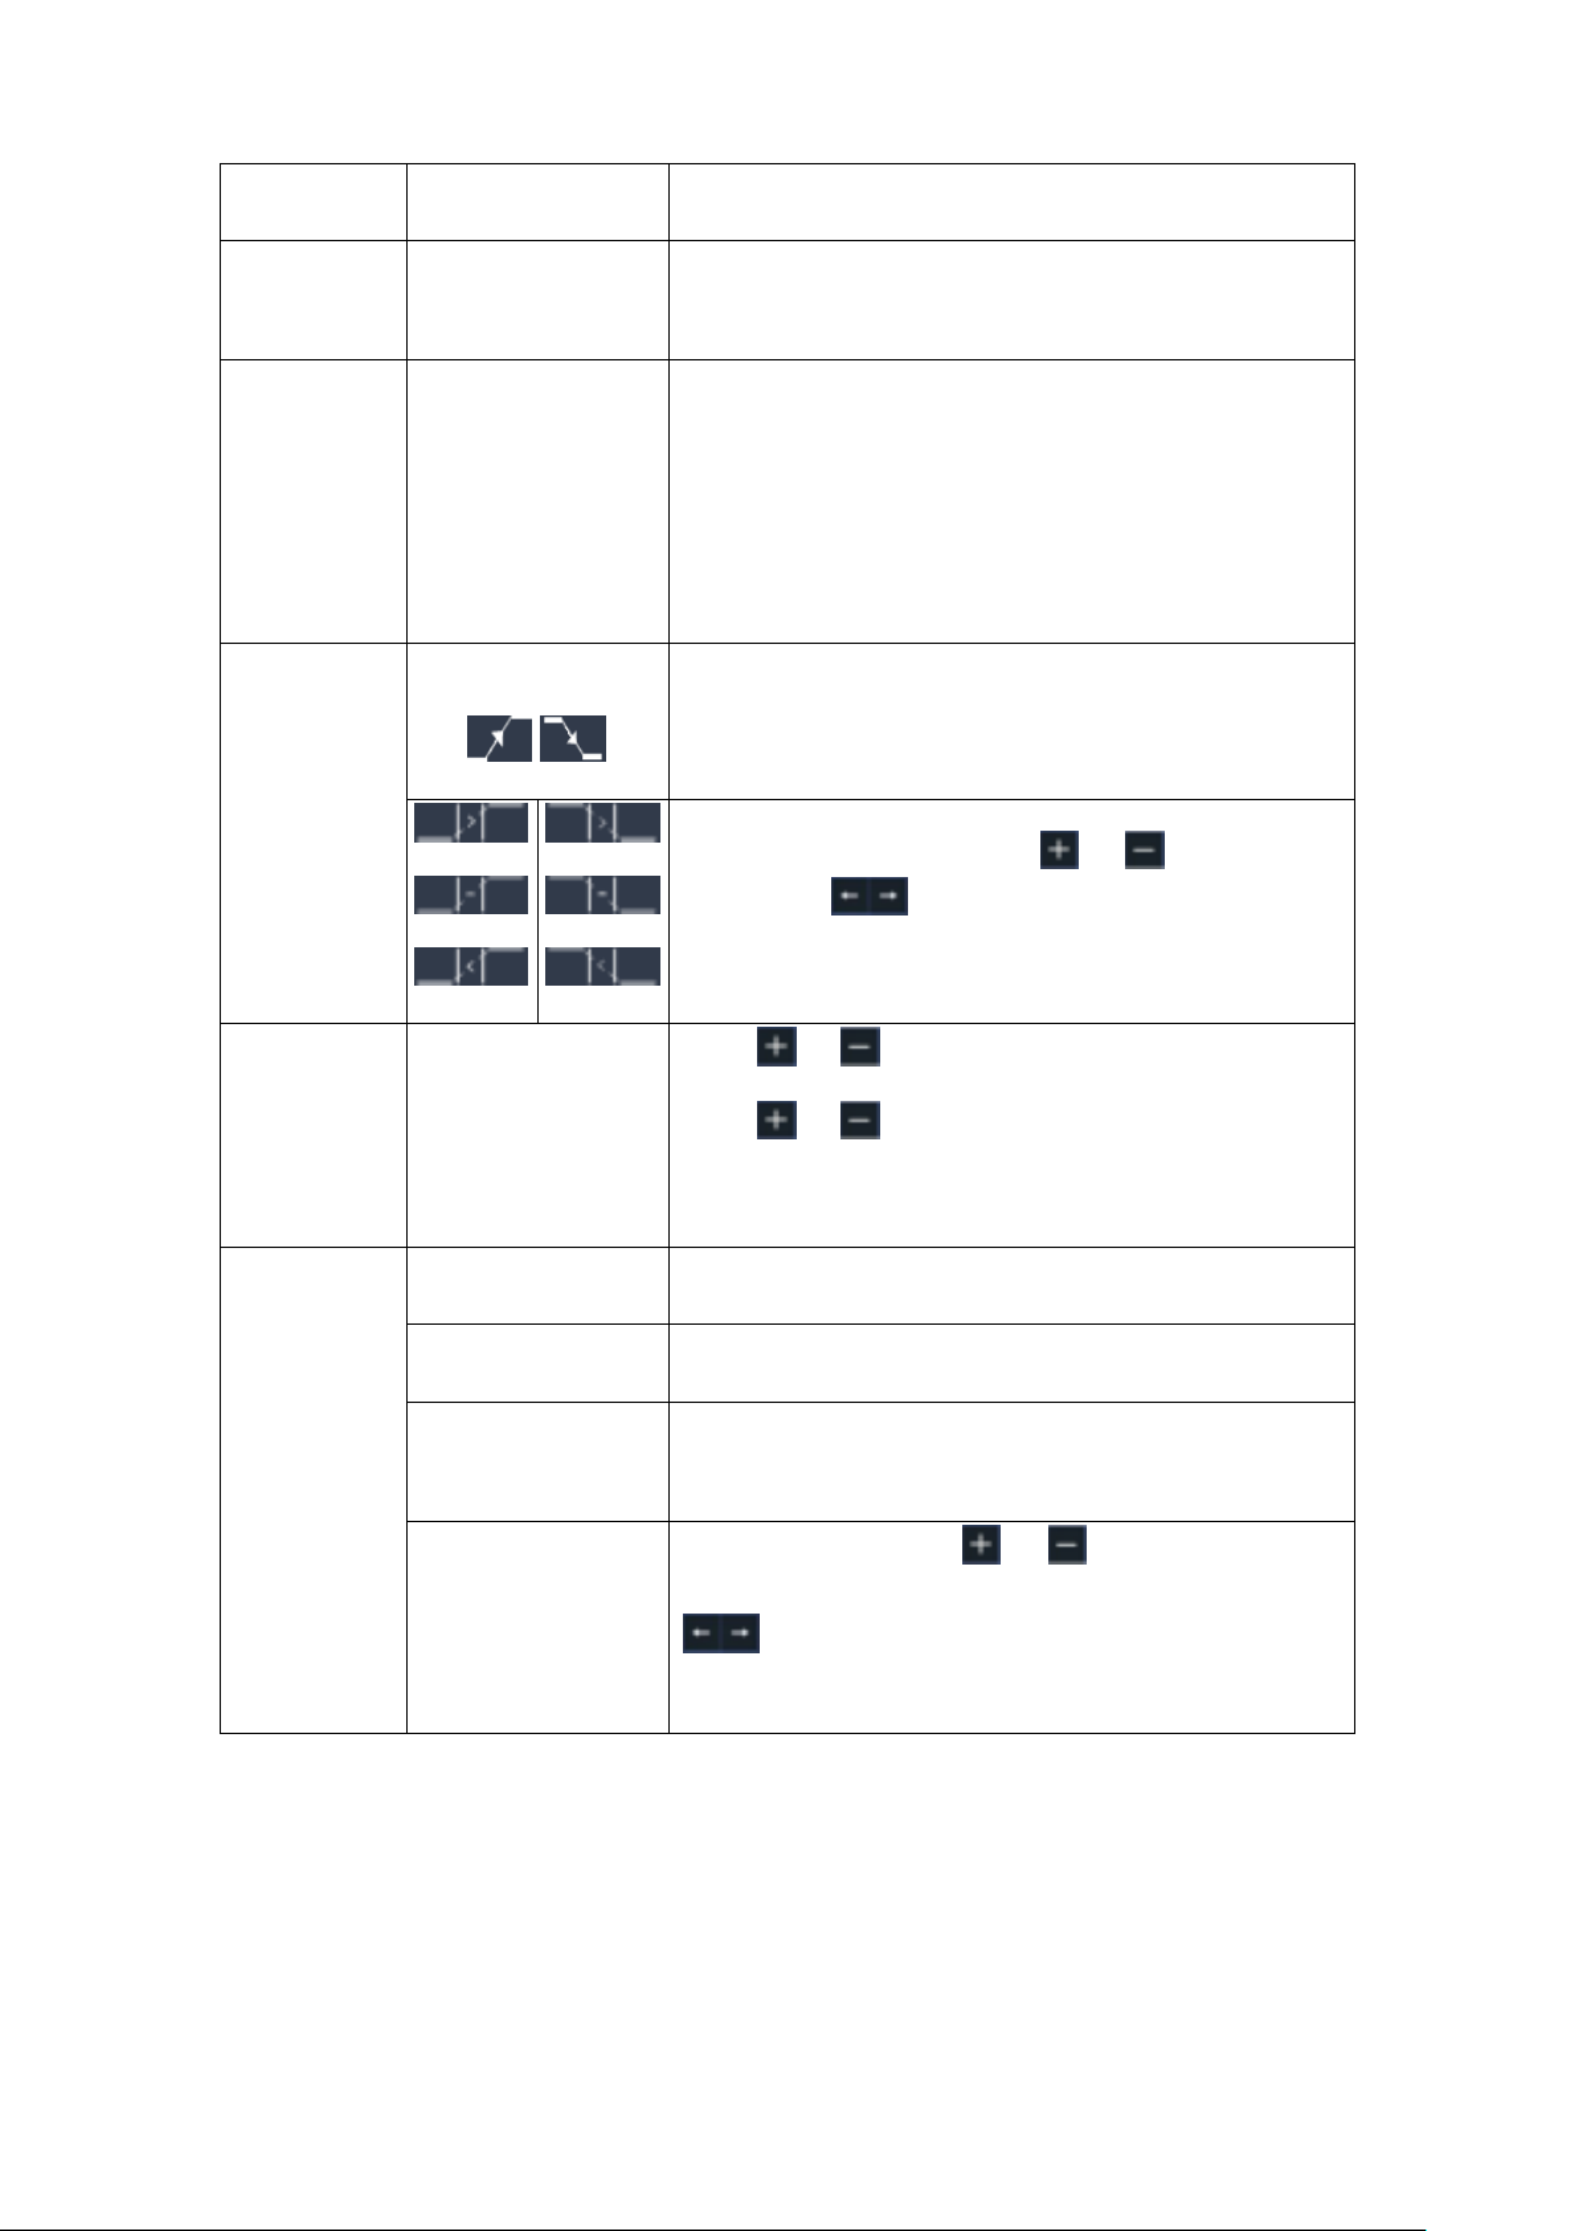
Coupling
DC
AC
GROUND
Pass both AC and DC components of the input
signal.
Blocks the DC component in the input signal
Disconnect the input signal.
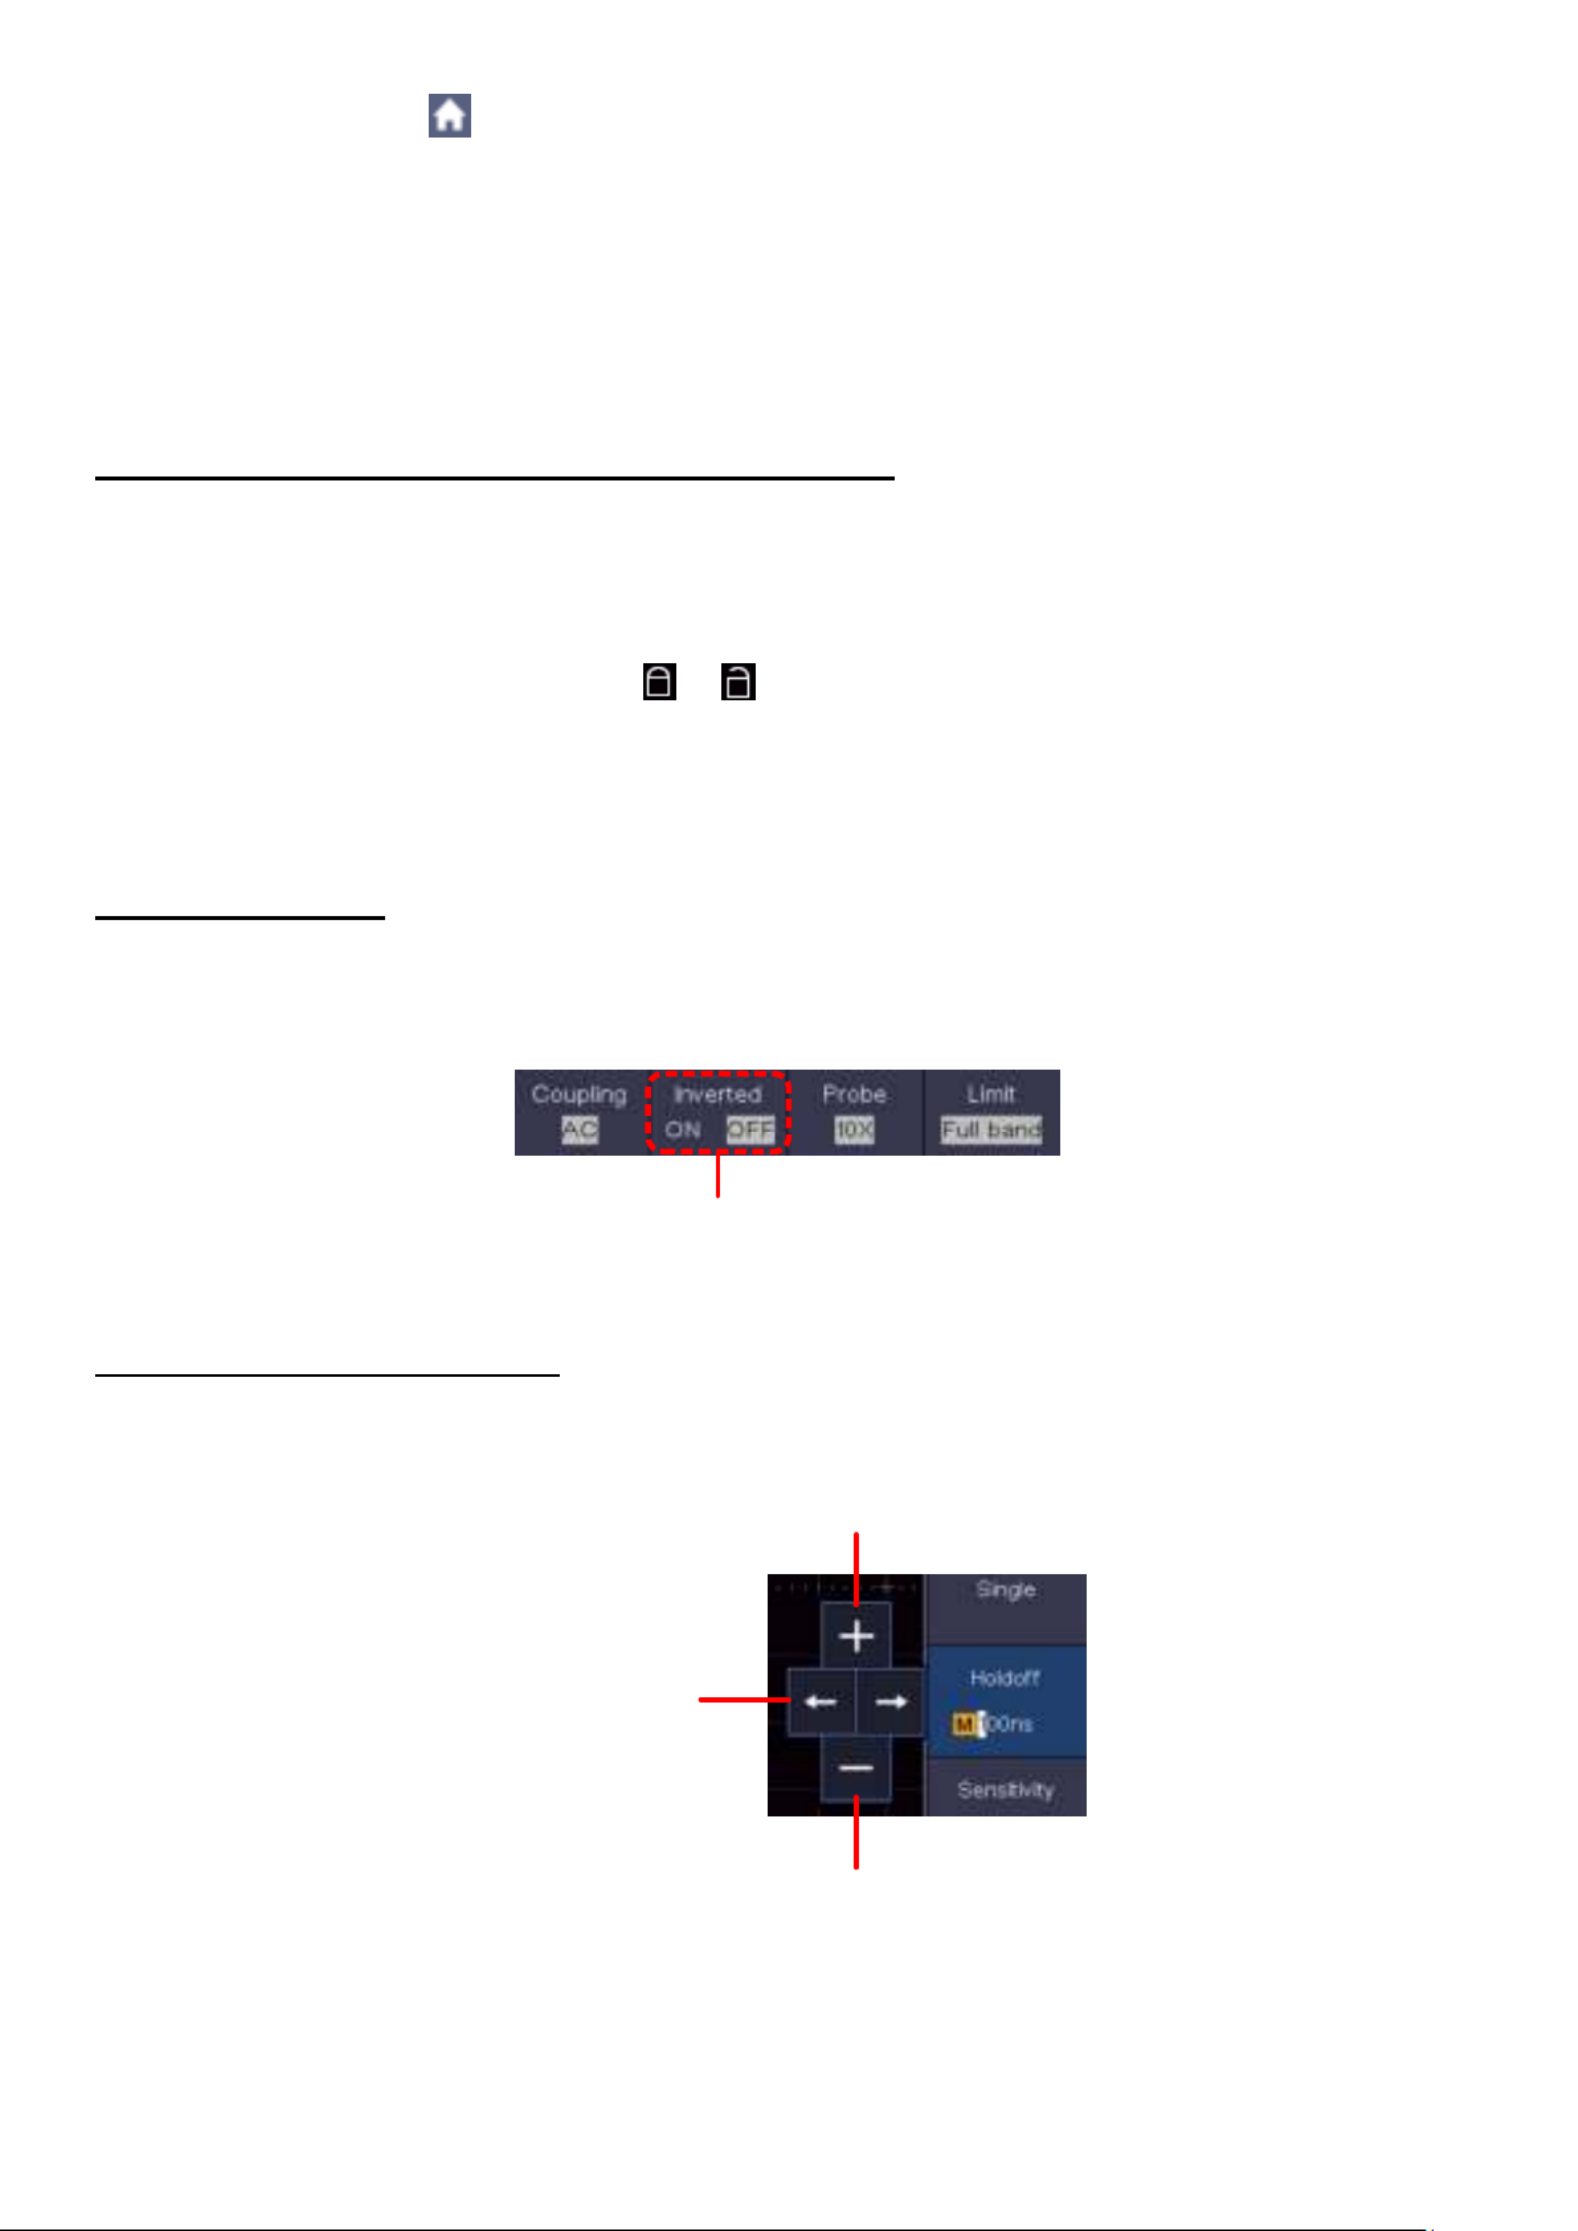
Inverted
On
Off
Display inverted waveform
Display original waveform
Probe
Attenuation
0.001X
to
1000X
Select a attenuation factor that corresponds to
the probe in order to obtain a correct
representation of the vertical scale factor.
Current
measure -
ment
Yes
No
If you are measuring current by probing the
voltage drop across a resistor, choose Yes
A/V (mA/V)
V/A (mV/A)
Click or to set the Amps/Volts ratio. The
range is 100 mA/V - 1 KA/V
Amps/Volts ratio = 1/Resistor value
Volts/Amp ratio is automatically calculated
Limit
Full band
20M
Full bandwidth
Limits the channel bandwidth to 20 MHz to
reduce visible noise

- - 26
6.1.1 Setting the channnel coupling
As an example, let's take a square wave signal on channel 1 that contains a DC bias. Proceed as
follows:
1. Press the CH 1 button to access the CH 1 menu
2. Press pairing in the channel menu
3. Select DC to view the DC and AC components of the signal
4. Select AC to display the AC components of the signal
6.1.2 Setting the probe attenuation
For correct measurement results, the settings of the attenuation factor in the operating menu of
the channel should always correspond to those of the probe (probe compensation page 15). If the
attenuation factor of the probe is 1: 1, the setting for the input channel should also be X1.
Proceed as follows, e.g. to set a attenuation factor of 10: 1 for channel 1:
1. Press the CH 1 button to enter the menu
2. Select the Sensor function. After that select the attenuation factor 10x on the left side of the
display
6.1.3 Current measurement
In order to perform a current measurement with the oscilloscope, you have to perform the voltage
drop on a resistor / shunt. In the following example, the current is measured by the voltage drop
across a resistor that has 1 Ω:
1. Press the CH 1 button to enter the menu
2. Now select the Probe function and switch from No to Yes in the Measurement Current
selection on the right. Now the setting for the V / A display appears. This shows the
respective display ratio of current to voltage. You can change this ratio by pressing the
button using the arrow keys and the + and - keys
6.1.4 Invert a waveform
The inverted waveform rotates the displayed signal 180 degrees from the phase of the ground
potential.
1. To invert the waveform, press the CH1 key
2. Press the Invert button to toggle between the On and Off settings
- - 27
6.1.5 Setting the bandwidth limit
When the high frequency components of a waveform are not important for your analysis,
bandwidth limiting can be used to suppress frequencies above 20 MHz.
Proceed as follows:
1. Press the CH 1 button to enter the menu
2. Select the limit value function
3. Now select the 20M function to only display frequencies up to 20 MHz
4. lect the Full Band function to measure all frequencies up to the maximum bandwidth Se
6.2 Set the horizontal system
To set the horizontal system, the HOR function key and the two rotary knobs are used as follows:
- Press the HOR key to activate the horizontal setting
- With the upper rotary knob you are now able to determine the horizontal position of the
respective channels
- The sampling rate of the respective channel is set with the lower rotary knob
- Press the HOR key again to activate the waveform zoom function
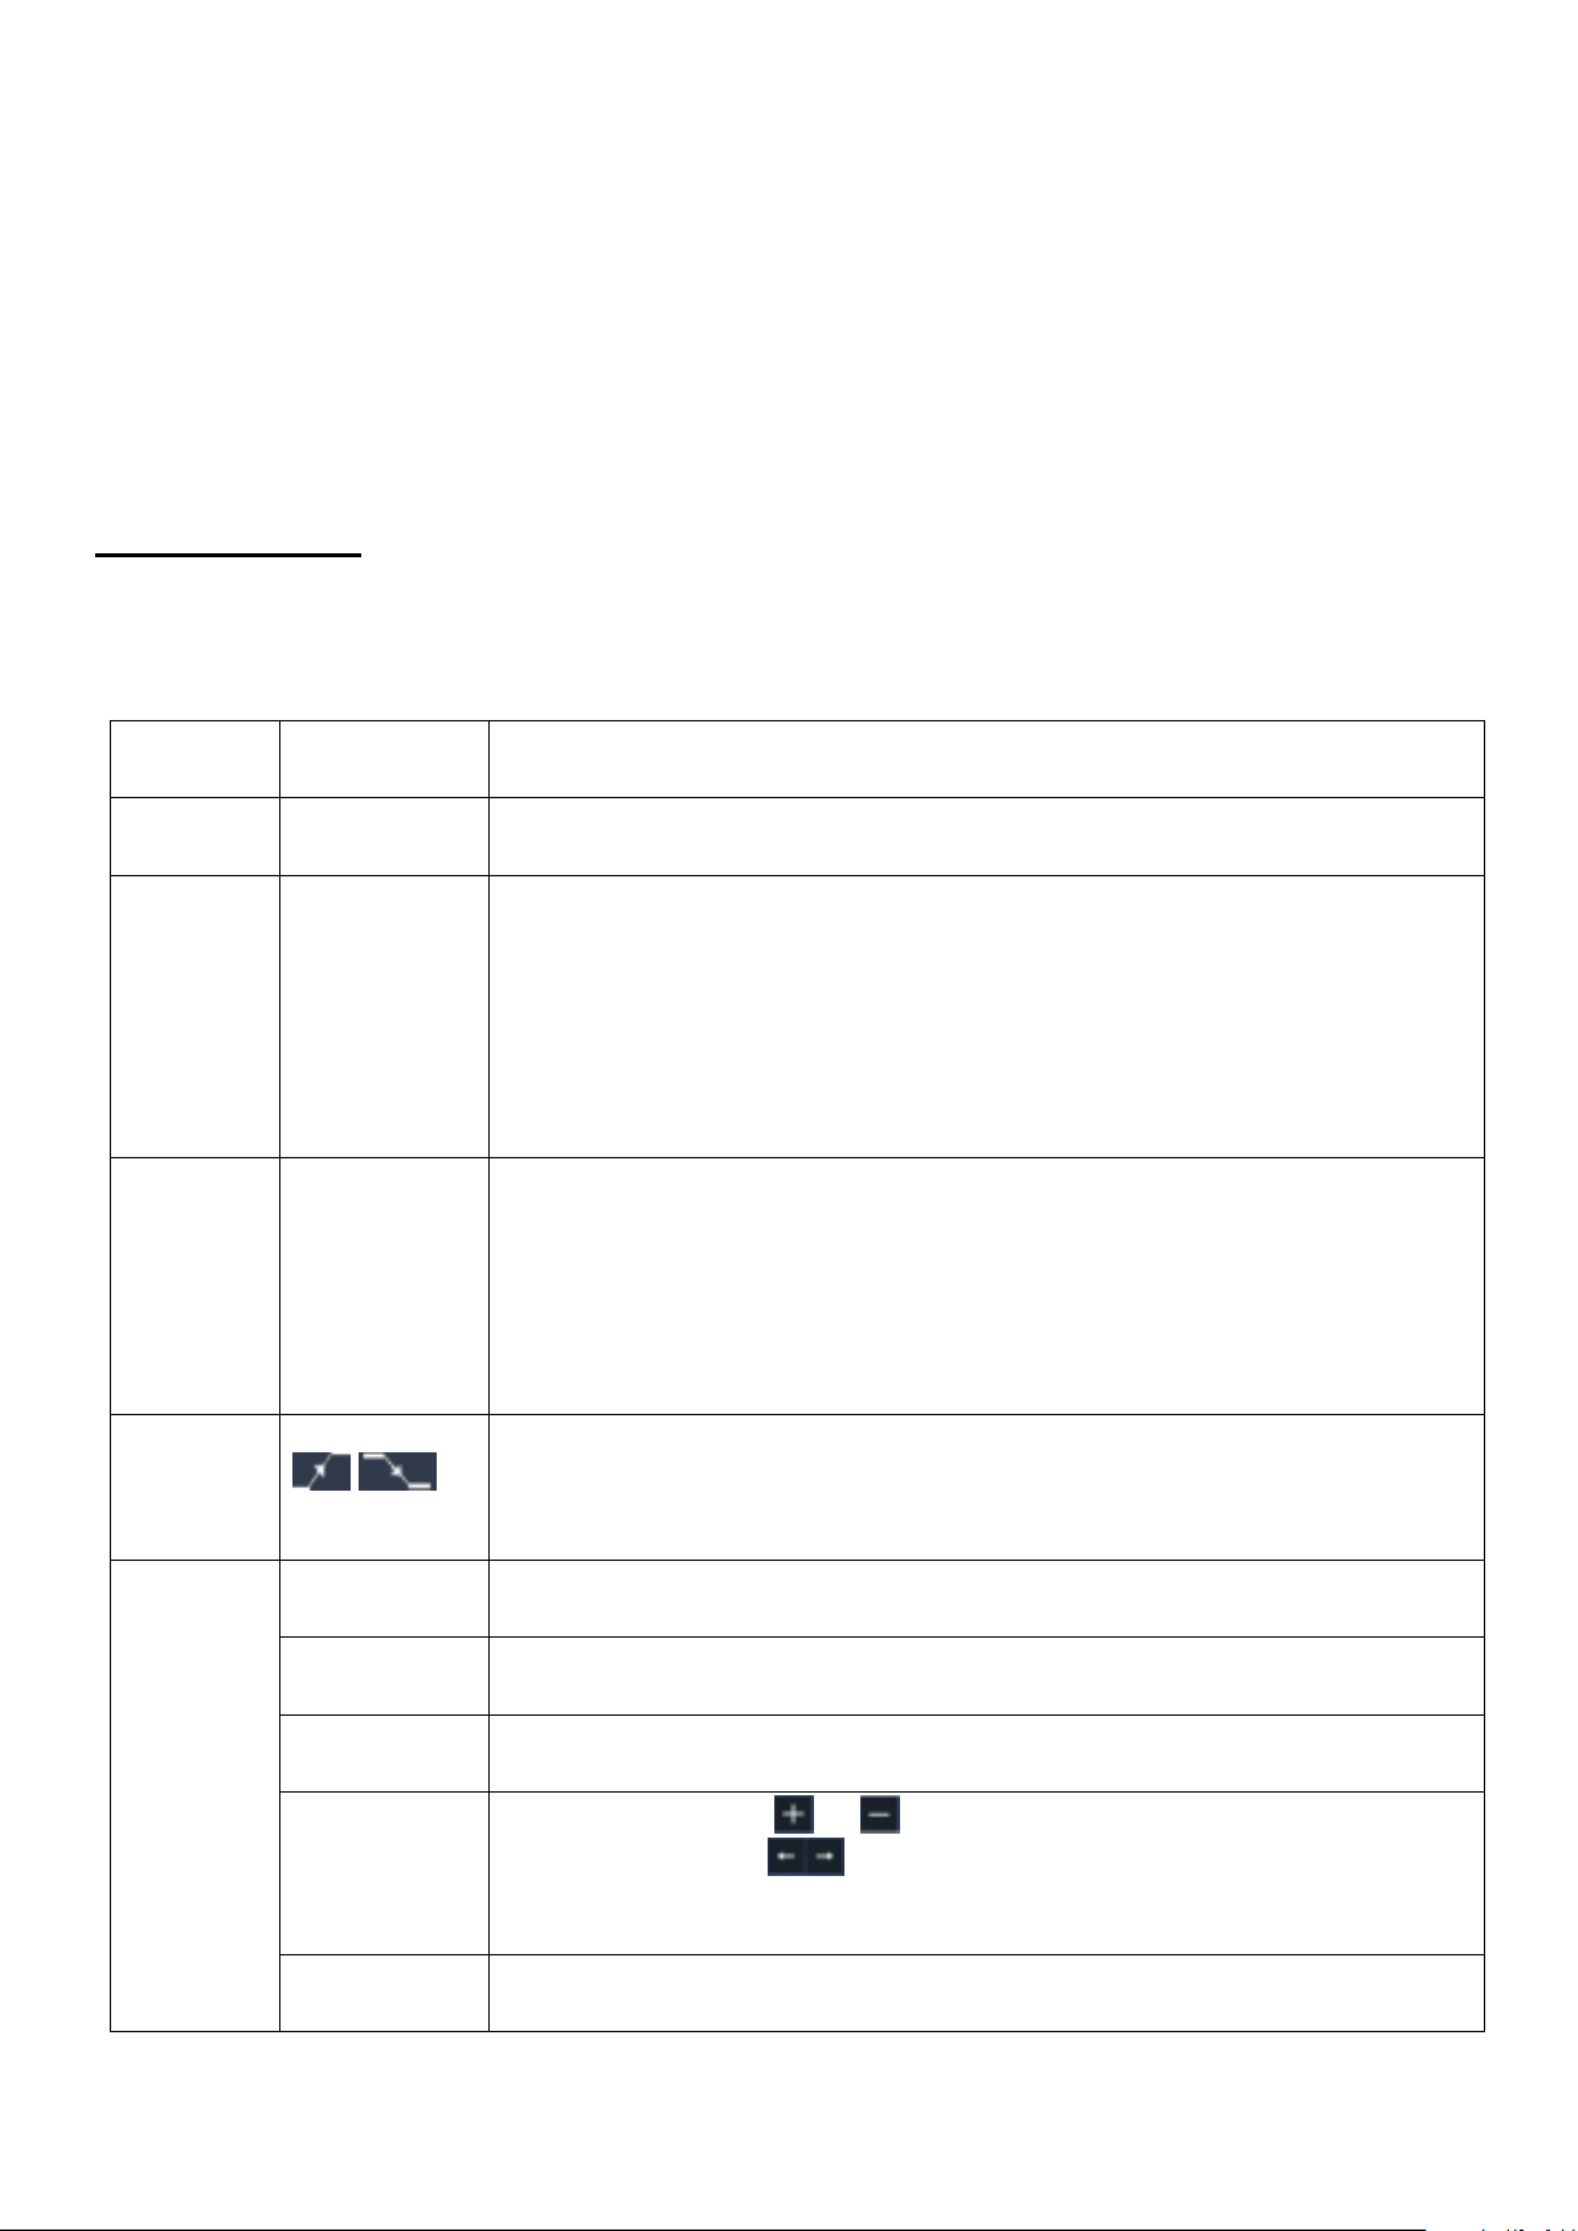
6.3 Waveform zoom function
Press the horizontal HOR button twice and enter the horizontal zoom mode for the waveform. The
upper part of the display shows the main window and the lower part the horizontal zoomed
window. The horizontal zoom window is the horizontal enlarged part of the selected area in the
main window.
Figure 4.0 Waveform zoom function

- - 28
6.4 Operation of the function menu
The operating area of the function menu comprises 13 function menu keys: Trig Menu, Acquire,
Utility, Autoscale, Save, Measure, Cursor, Math, Decode, HOR, FFT, XY, P / F, DMM as well
as 5 immediate selection keys: Autoset, Run / Stop, Single, Copy, default.
6.5 Set the trigger system
The trigger determines when the oscilloscope begins acquiring data and displaying the waveform.
Once properly set, the trigger can convert a fluctuating reading into a meaningful waveform.
When the oscilloscope begins acquiring data, it records enough data to plot the waveform to the
left of the trigger point. The oscilloscope continues to acquire data while it waits for a trigger
condition. When a trigger is detected, the device continues to record enough data to display the
waveform to the right of the trigger point.
The trigger control area consists of 1 rotary knob and 2 menu buttons.
6.5.1 Single trigger
Trigger control
The device provides four types of triggers: single trigger (single), alt trigger, logic trigger and bus
trigger. Each trigger type has different submenus.
There are two ways to get into the trigger mode:
Button operation: Press Menu in the trigger field to open the trigger menu. With H1 you can then
select the extended trigger menu, which you can scroll (turn) and select (press) with the
multipurpose rotary knob.
Touchscreen operation: Press the house symbol to open the touch menu. Select Trig Menu
and then the trigger (Single, Alt, Logic, Bus) in the lower menu. The trigger type can then be
selected under Type in the right image menu.
Single: Uses a single trigger to display a stable waveform on both channels.
Logic trigger: Triggers a signal according tot he conditions of the logic ratio
Bus trigger: Sets bus timing triggers
Trigger description
The single, logic and bus trigger menus are described below:
Edge trigger: Occurs when the trigger input runs through a specific voltage level with the
specified slope.
Video trigger: Trigger on fields or lines for a standard video signal
Slope trigger: The oscilloscope begins to trigger according to the rate of rise or fall of the signal
Pulse trigger: Finds impulses with certain widths
Runt trigger: Trigger pulses that run through one trigger level but not the other trigger level.
- - 29
Window trigger: Gives a high trigger level and a low trigger level. The oscilloscope
triggers when the input signal passes through the high or low trigger level.
Timeout trigger: The oscilloscope triggers when the time interval from the time of the
rising edge (or falling edge) due to the trigger level if the neighboring falling edge (or the rising
edge) due to the trigger level is greater than the set timeout time.
Nth Edge trigger: The oscilloscope triggers on the Nth edge that appears on the specified idle
time.
6.5.2 Edge trigger
An edge trigger occurs at the input signal trigger threshold. Select the Edge trigger mode to trigger
on the rising or falling edge of the signal.
Menu
Settings
Description
Single
Edge
Set vertical channel trigger type as edge trigger
Source
CH1
CH2
CH3
CH4
Channel 1 as trigger signal.
Channel 2 as trigger signal.
Channel 3 as trigger signal.
Channel 4 as trigger signal.
Coupling
AC
DC
HF
Block the direct current component.
Allow all component pass.
Block the high-frequency signal, only low-frequency component
pass
Slope
Trigger on rising edge
Trigger on falling edge
Modus
&
Holdoff
Auto
Acquire waveform even no trigger occurs
Normal
Acquire waveform when trigger occurs
Single
When trigger occurs, acquire one waveform then stop
Holdoff
100 ns - 10 s, click or to set time interval before another
trigger occur, click to move cursor to choose which digit to be
set.
Sensitivity
Set the trigger sensitivity.

- - 30
Trigger level:
The trigger level indicates vertical trig position of the channel, turn the trig level knob or slide on
the touch screen upward and downward to move trigger level, during setting, an orange red dotted
line displays to show trig position, and the value of trigger level changes at the right corner, after
setting, dotted line disappears.
6.5.3 Video trigger
Select the video mode to trigger on video fields or video lines of NTSC, PAL or SECAM standard
video signals. In the video trigger mode, the setting information is displayed at the bottom right of
the screen, e.g: indicates that the video trigger has been selected on CH1 and the
sync type "even ".
Video trigger m u en :
Menu
Settings
Description
Trigger m ode
Video
Set vertical channel trigger type as video trigger
Source
CH1
CH2
CH3
CH4
Select CH1 as the trigger source
Select CH2 as the trigger source
Select CH3 as the trigger source
Select CH4 as the trigger source
Mode
NTSC
PAL
SECAM
Select video modulation
Sync
Line
Field
Odd
Even
Line NO.
Synchronic trigger in video line
Synchronic trigger in video field
Synchronic trigger in video odd filed
Synchronic trigger in video even field
Synchronic trigger in designed video line, click or
to set the line number
Mode
Holdoff
Auto
Acquire waveform even no trigger occurred
- - 31
6.5.4 Pulse width trigger
Pulse trigger occurs according to the width of pulse. The abnormal signals can be detected
through setting up the pulse width condition.
In Pulse Width Trigger mode, the trigger setting information is displayed on bottom right of the
screen, for example indicates that trigger type is pulse width, trigger source ,
is CH1, coupling is DC, polarity is positive, and trigger level is 0.00mV.
Pulse trigger menü :
Menu
Settings
Description
Trigger m e od
Pulse
Set vertical channel trigger type as pulse trigger.
Source
CH1
CH2
CH3
CH4
Select CH1 as the trigger source
Select CH2 as the trigger source
Select CH3 as the trigger source
Select CH4 as the trigger source
Coupling
AC
DC
Not allow DC portion to pass.
Allow all portion pass.
When
Choose the polarity
Select pulse width condition and click or to set
time, click to move cursor to choose which digit to
be set.
Mode
Holdoff
Auto
Normal
Single
Holdoff
Sensitivity
Acquire waveform even no trigger occurred
Acquire waveform when trigger occurred
When trigger occurs, acquire one waveform then stop
100 ns - 10 s, click or to set time interval before
another trigger occur, click to move cursor to
choose which digit to be set
Set the trigger sensitivity
6.5.5 Slope trigger
The slope mode allows the oscilloscope to trigger on the rising / falling edge of a signal within a
specified period of time. In the slope trigger mode, the setting information is shown on the lower
right edge of the screen, e.g: indicates that the slope trigger has been selected
on CH1, slope increasing and the difference between the up-level and low-level threshold value is
0.00mV.
- - 32
Slope trigger menu list:
Menu
Setting
Description
Single
Slope
Set vertical channel trigger type as slope
trigger.
Source
CH1
CH2
CH3
CH4
Select CH1 as the trigger source
Select CH2 as the trigger source
Select CH3 as the trigger source
Select CH4 as the trigger source
When
slope
Slope selecting
Set slope condition; click or to set slope
time, click to move cursor to choose
which digit to be set.
Threshold
&SlewRate
High level
Low level
Slew rate
Click or to set the High level upper limit.
Click or to set Low level lower limit.
Slew rate = (High level - Low level) / Settings
Mode
Holdoff
Auto
Acquire waveform even no trigger occurred
Normal
Acquire waveform when trigger occurred
Single
When trigger occurs, acquire one waveform
then stop
Holdoff
100 ns 10 s, click or to set time –
interval before another trigger occur, click
to move cursor to choose which digit to
be set.
- - 33
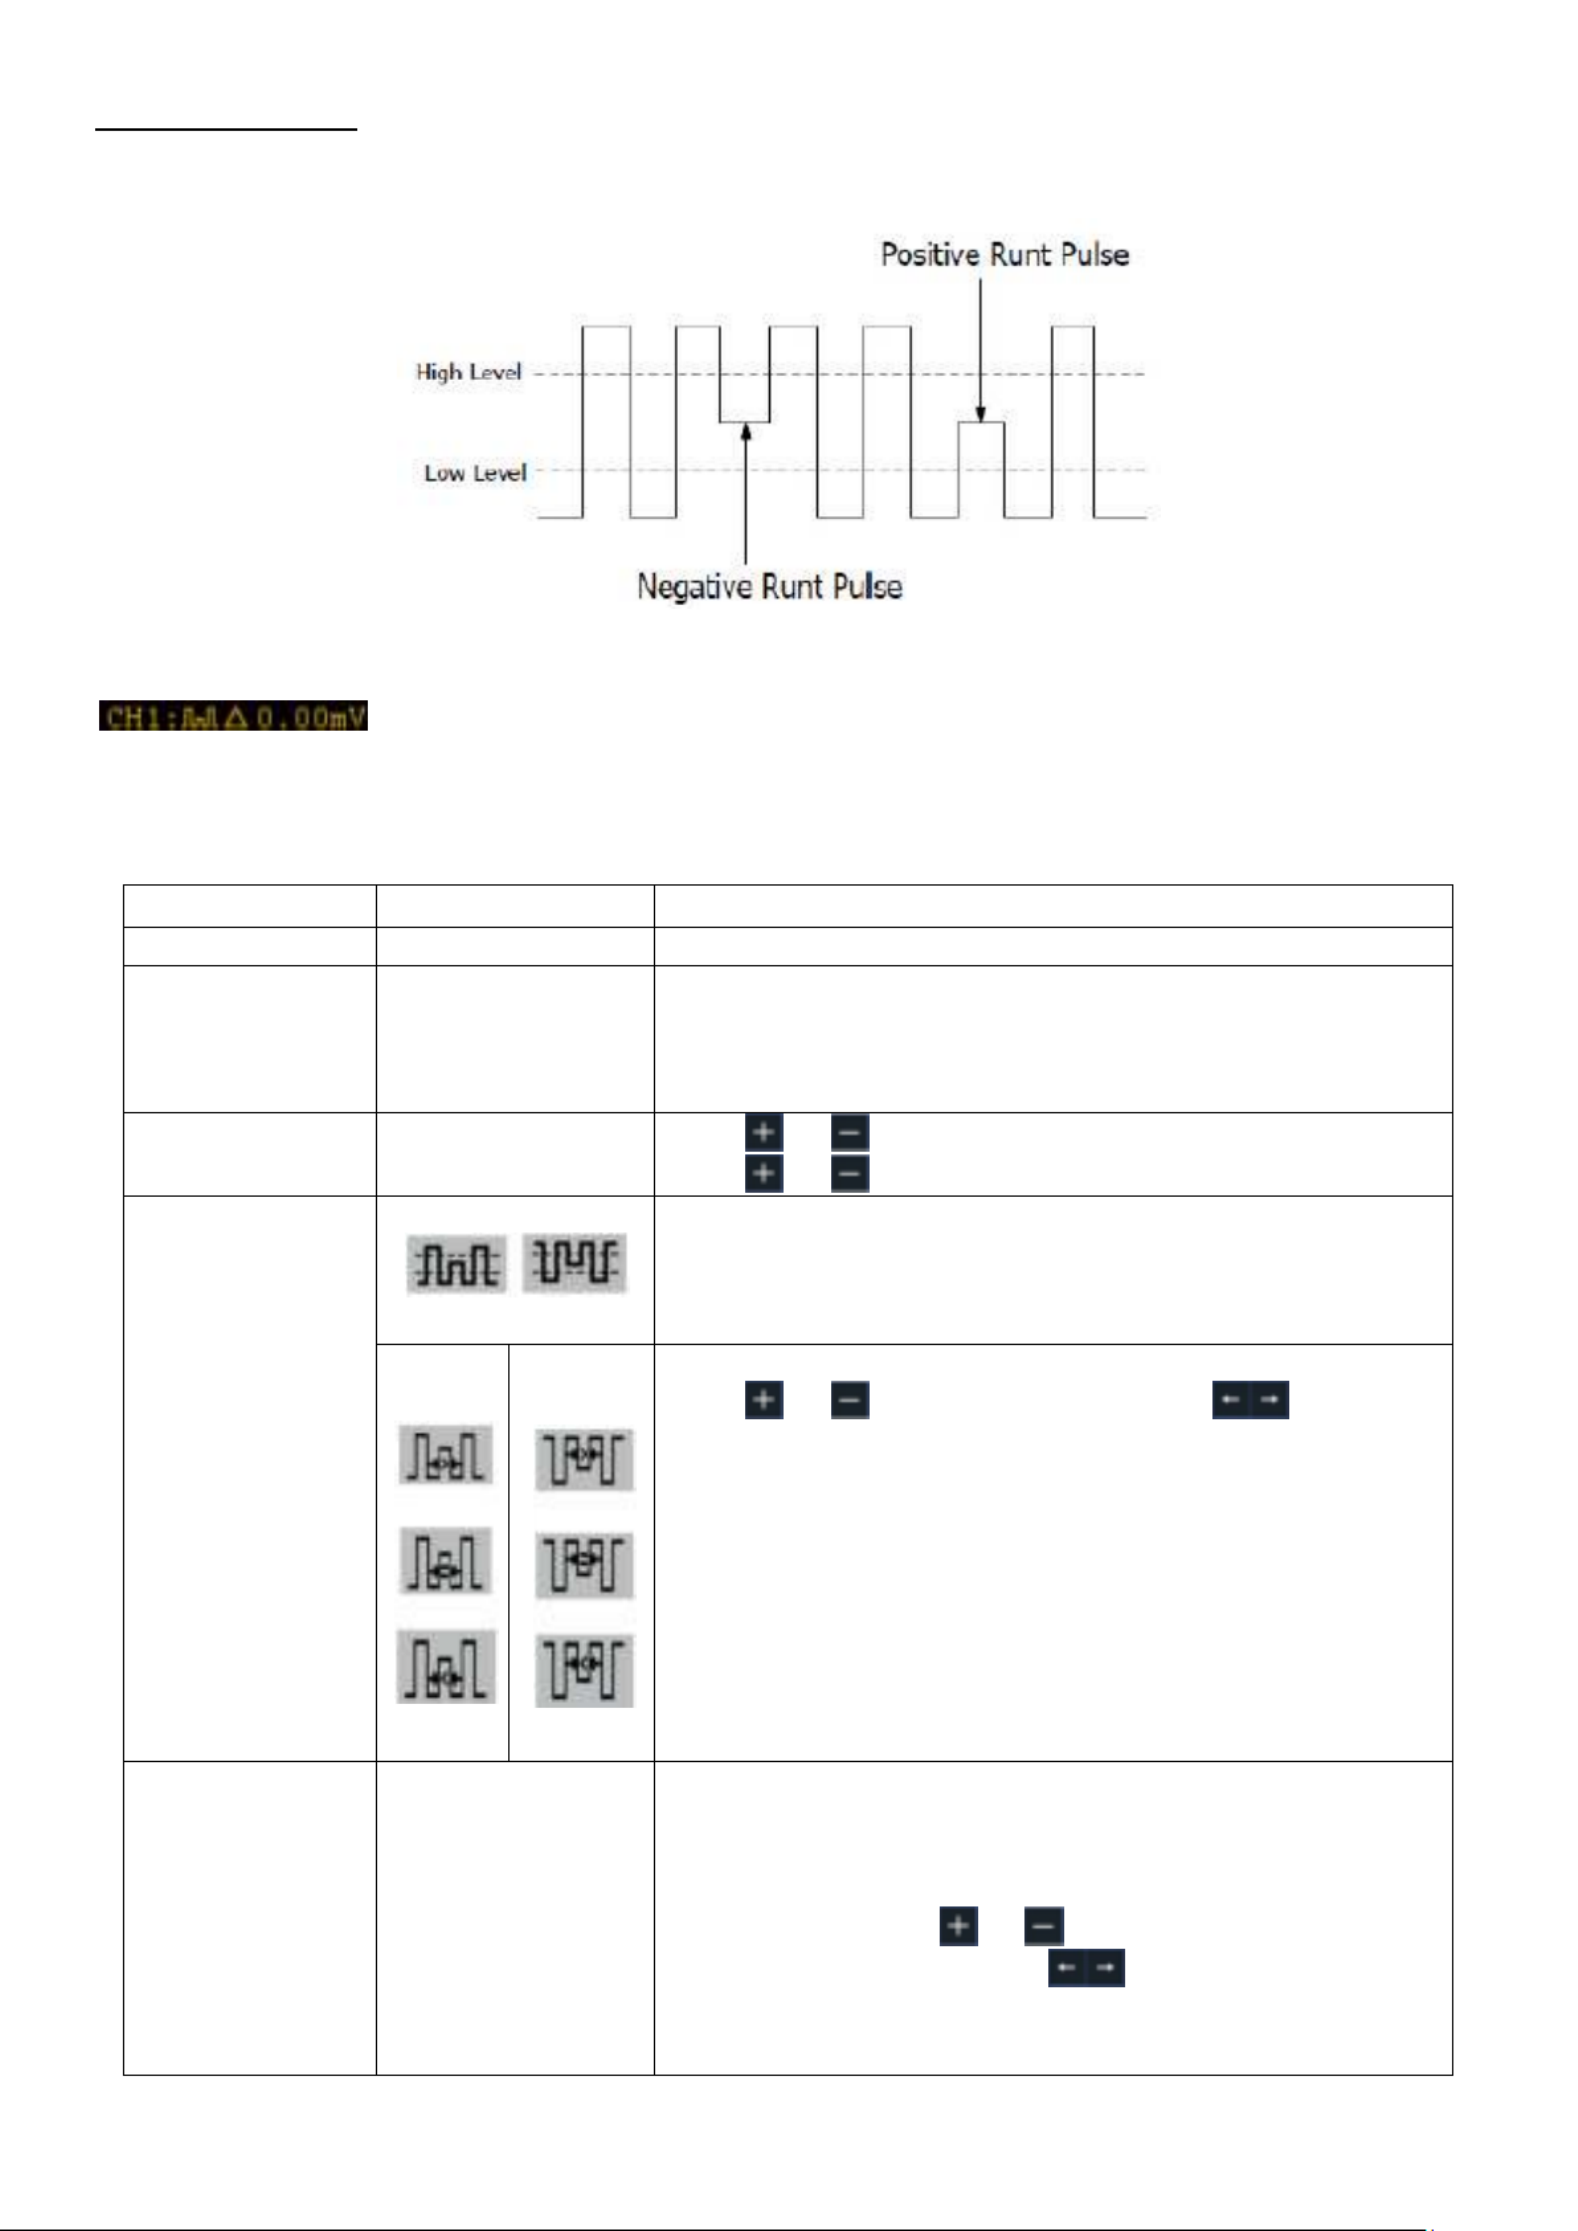
6.5.6 Runt trigger
The runt trigger records pulses that run through one trigger level, but not through another, as
shown in the graphic.
In runt trigger mode, the setting information is shown at the bottom right of the screen, e.g:
indicates that the runt trigger on CH1 with positive polarity has been selected
and the difference between the up-level and low-level threshold value is 0.00mV.
Runt trigger m u en :
Menu
Settings
Description
Trigger Mode
Runt
Set vertical channel trigger type as runt trigger.
Source
CH1
CH2
CH3
CH4
Select CH1 as the trigger source
Select CH2 as the trigger source
Select CH3 as the trigger source
Select CH4 as the trigger source
Threshold
Up Level
Low Level
Click or to set the up level threshold.
Click or to set the low level threshold.
Condition
Polarity
Positive Polarity, the oscilloscope triggers on the
positive runt pulse.
Negative Polarity, the oscilloscope triggers on the
negative runt pulse.
Click or to set pulse width, click to move
cursor to choose which digit to be set.
Trigger when runt pulse is greater than the set pulse
width.
Trigger when runt pulse equals to the set pulse width.
Trigger when runt pulse is lower than the set pulse
width.
Mode
Holdoff
Auto
Normal
Single
Holdoff
Acquire waveform even no trigger occurred
Acquire waveform when trigger occurred
When trigger occurs, acquire one waveform then stop
100 ns - 10 s, click or to set time interval before
another trigger occur, click to move cursor to
choose which digit to be set.
- - 34
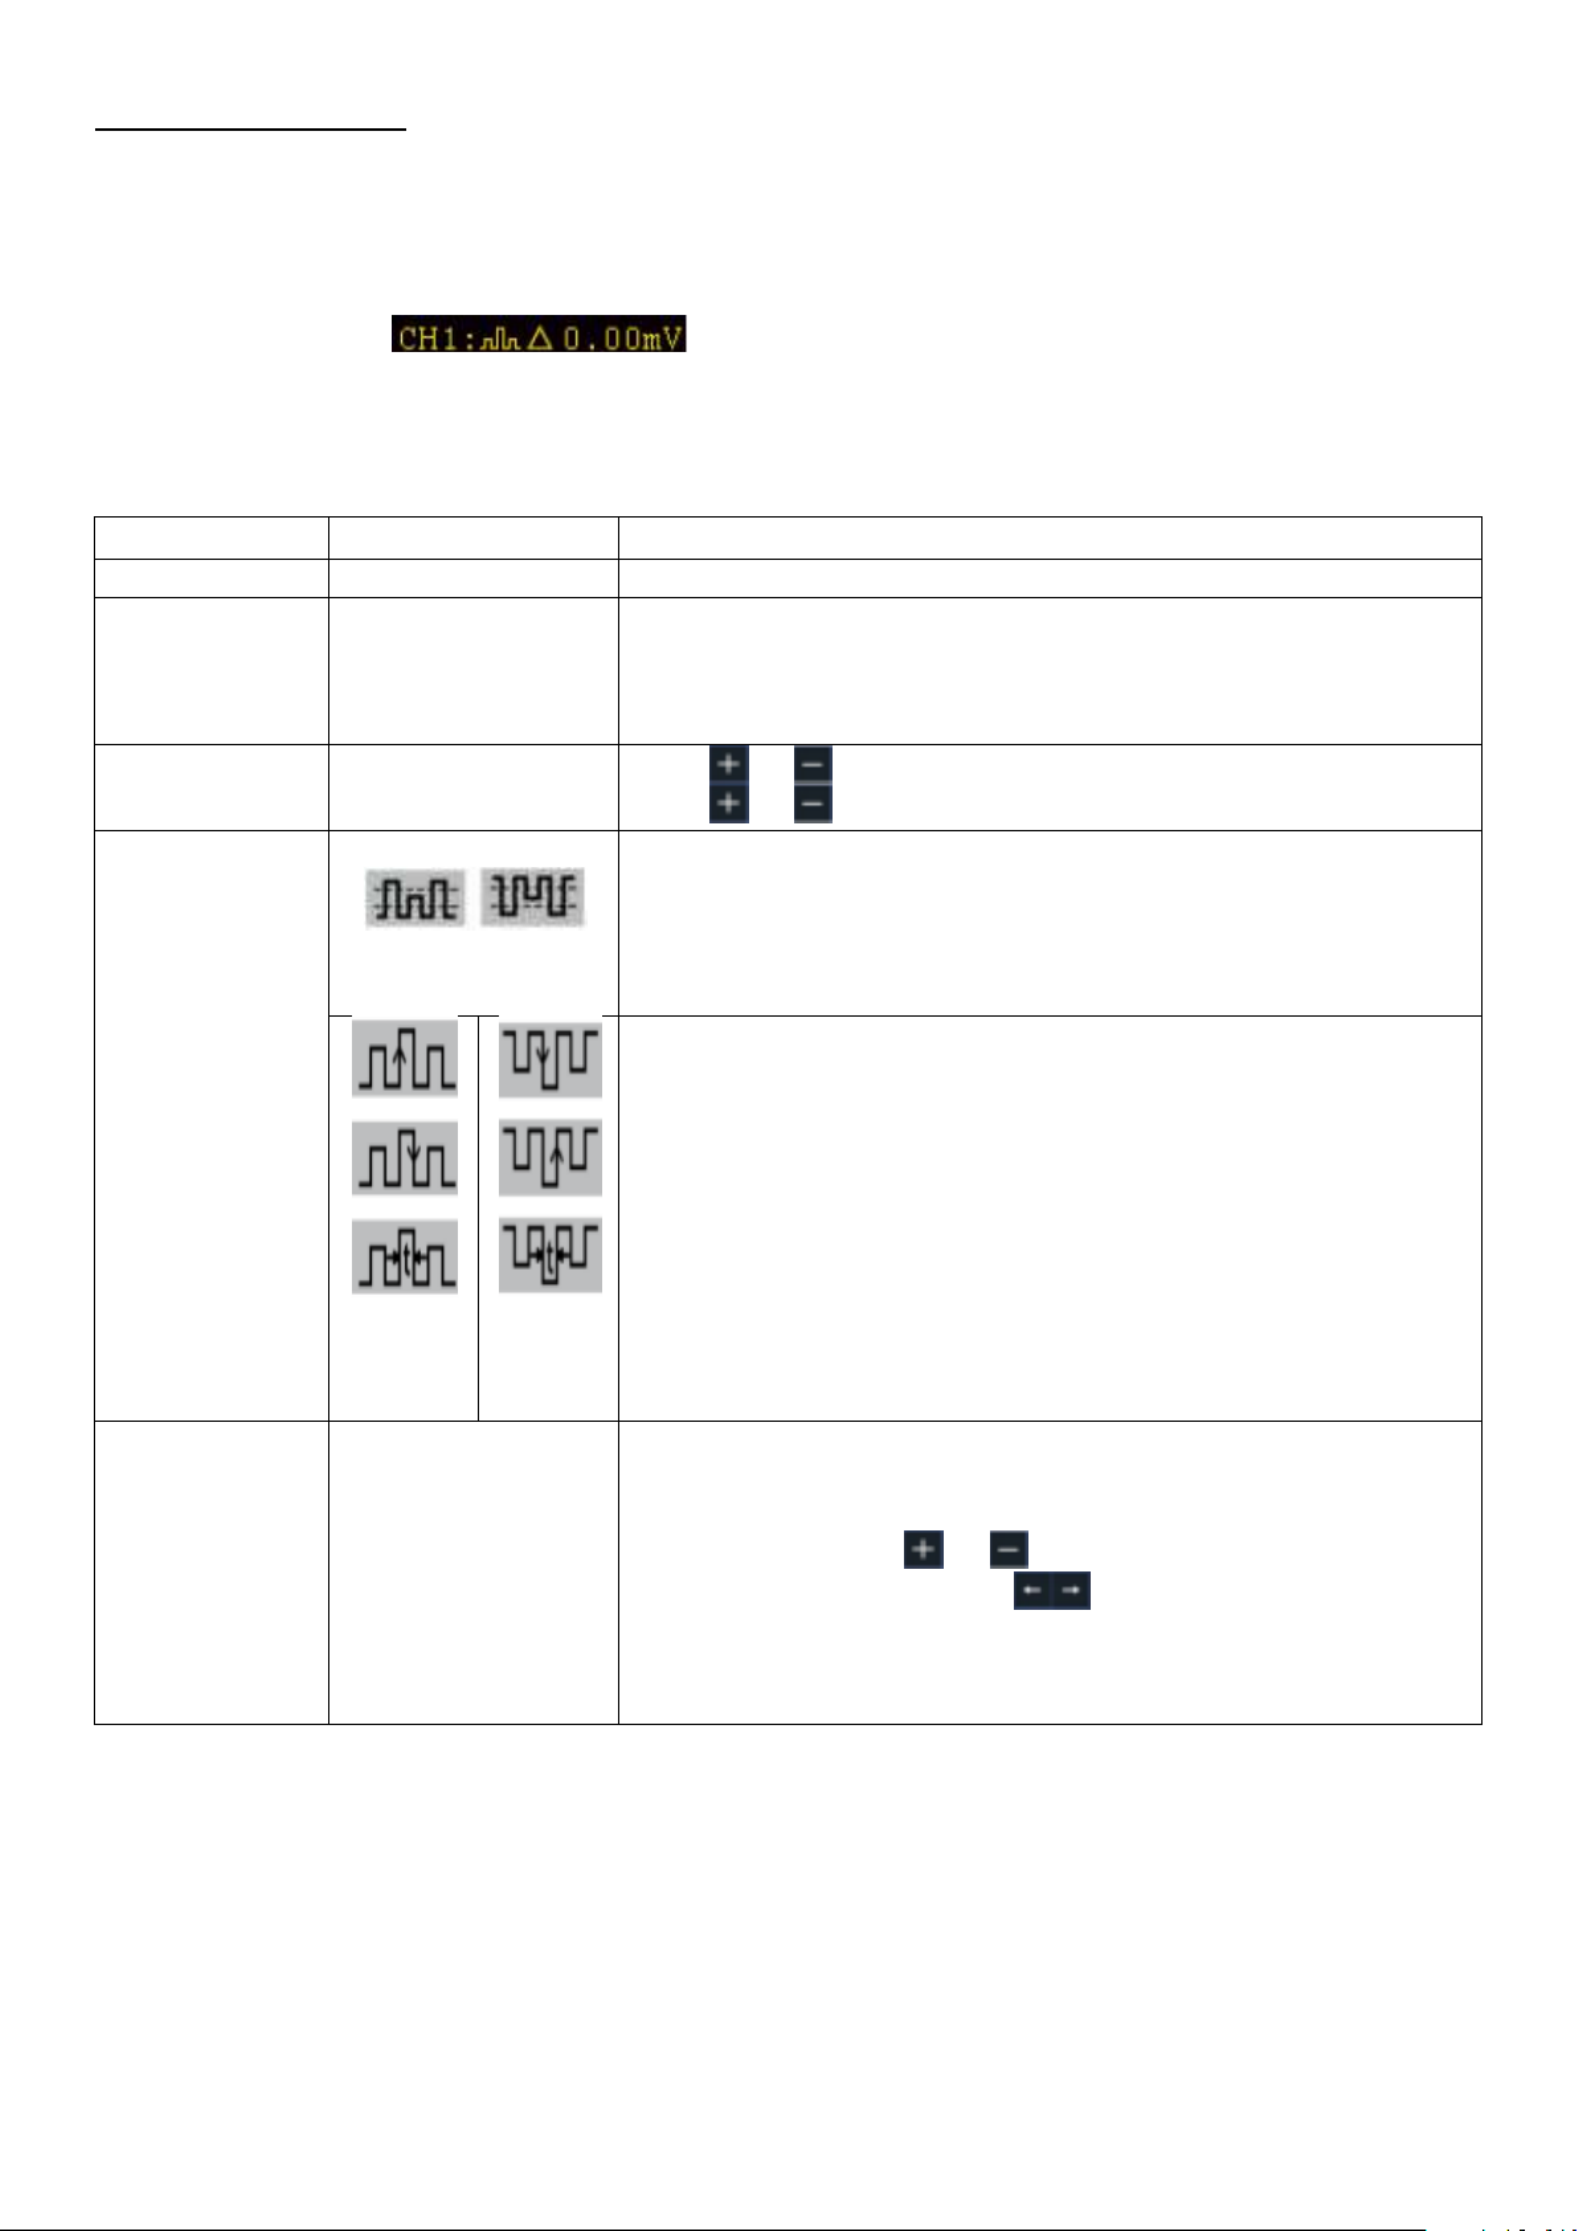
6.5. Window trigger 7
Provide a high trigger level and low trigger level, the oscilloscope triggers when the input signal
passes through the high trigger level or the low trigger level.
In Windows Trigger mode, the trigger setting information is displayed on bottom right of the
screen, for example, , indicates that trigger type is windows, trigger source is
CH1, polarity is positive, 0.00mV the differential between up level and low level threshold.
Fenster Trigger Menü :
Menu
Settings
Description
Trigger Mode
Window
Set vertical channel trigger type as Windows trigger.
Source
CH1
CH2
CH3
CH4
Select CH1 as the trigger source
Select CH2 as the trigger source
Select CH3 as the trigger source
Select CH4 as the trigger source
Threshold
Up Level
Low Level
Click or to set the up level threshold.
Click or to set the low level threshold.
Condition
Polarity
Positive Polarity, the oscilloscope triggers on the positive
Windows pulse.
Negative Polarity, the oscilloscope triggers on the negative
Windows pulse.
Enter: Triggers when the trigger signal enters the specified
trigger level range.
Exit: Triggers when the trigger signal exits the specified
trigger level range.
Time: Specify the hold time of the input signal after
entering the specified trigger level. The oscilloscope
triggers when the accumulated hold time is greater than
the windows time. Available range is 30ns-10s, default
100ns.
Mode
Holdoff
Auto
Normal
Single
Holdoff
Acquire waveform even no trigger occurred
Acquire waveform when trigger occurred
When trigger occurs, acquire one waveform then stop
100 ns - 10 s, click or to set time interval before
another trigger occur, click to move cursor to choose
which digit to be set.
- - 35
6.5.8 Timeout trigger
The oscilloscope triggers when the time interval from when the rising edge (or the falling edge)
passes through the trigger level to when the neighbouring falling edge (or the rising edge) passes
through the trigger level is greater than the timeout time set.
In Timeout Trigger mode, the trigger setting information is displayed on bottom right of the screen,
for example, , indicates that trigger type is Timeout, trigger source is CH1, edge
is positive, 0.00mV is up level or low level threshold.
Timeout trigger m u en :
Menu
Settings
Description
Trigger Mode
Timeout
Set vertical channel trigger type as Timeout trigger.
Source
CH1
CH2
CH3
CH4
Select CH1 as the trigger source
Select CH2 as the trigger source
Select CH3 as the trigger source
Select CH4 as the trigger source
Polarity
Edge
Start timing when the rising edge of the input signal
passes through the trigger level.
Start timing when the falling edge of the input signal
passes through the trigger level.
Configuration
Idle Time
Set idle time. Idle time means the minimum time of idle
clock before searching data that can meet trigger
conditions. Available range is 30ns-10s, default 100ns.
Mode
Holdoff
Auto
Normal
Single
Holdoff
Sensitivity
Acquire waveform even no trigger occurred
Acquire waveform when trigger occurred
When trigger occurs, acquire one waveform then stop
100 ns - 10 s, click or to set time interval before
another trigger occur, click to move cursor to
choose which digit to be set.
Set the trigger sensitivity.
- - 36
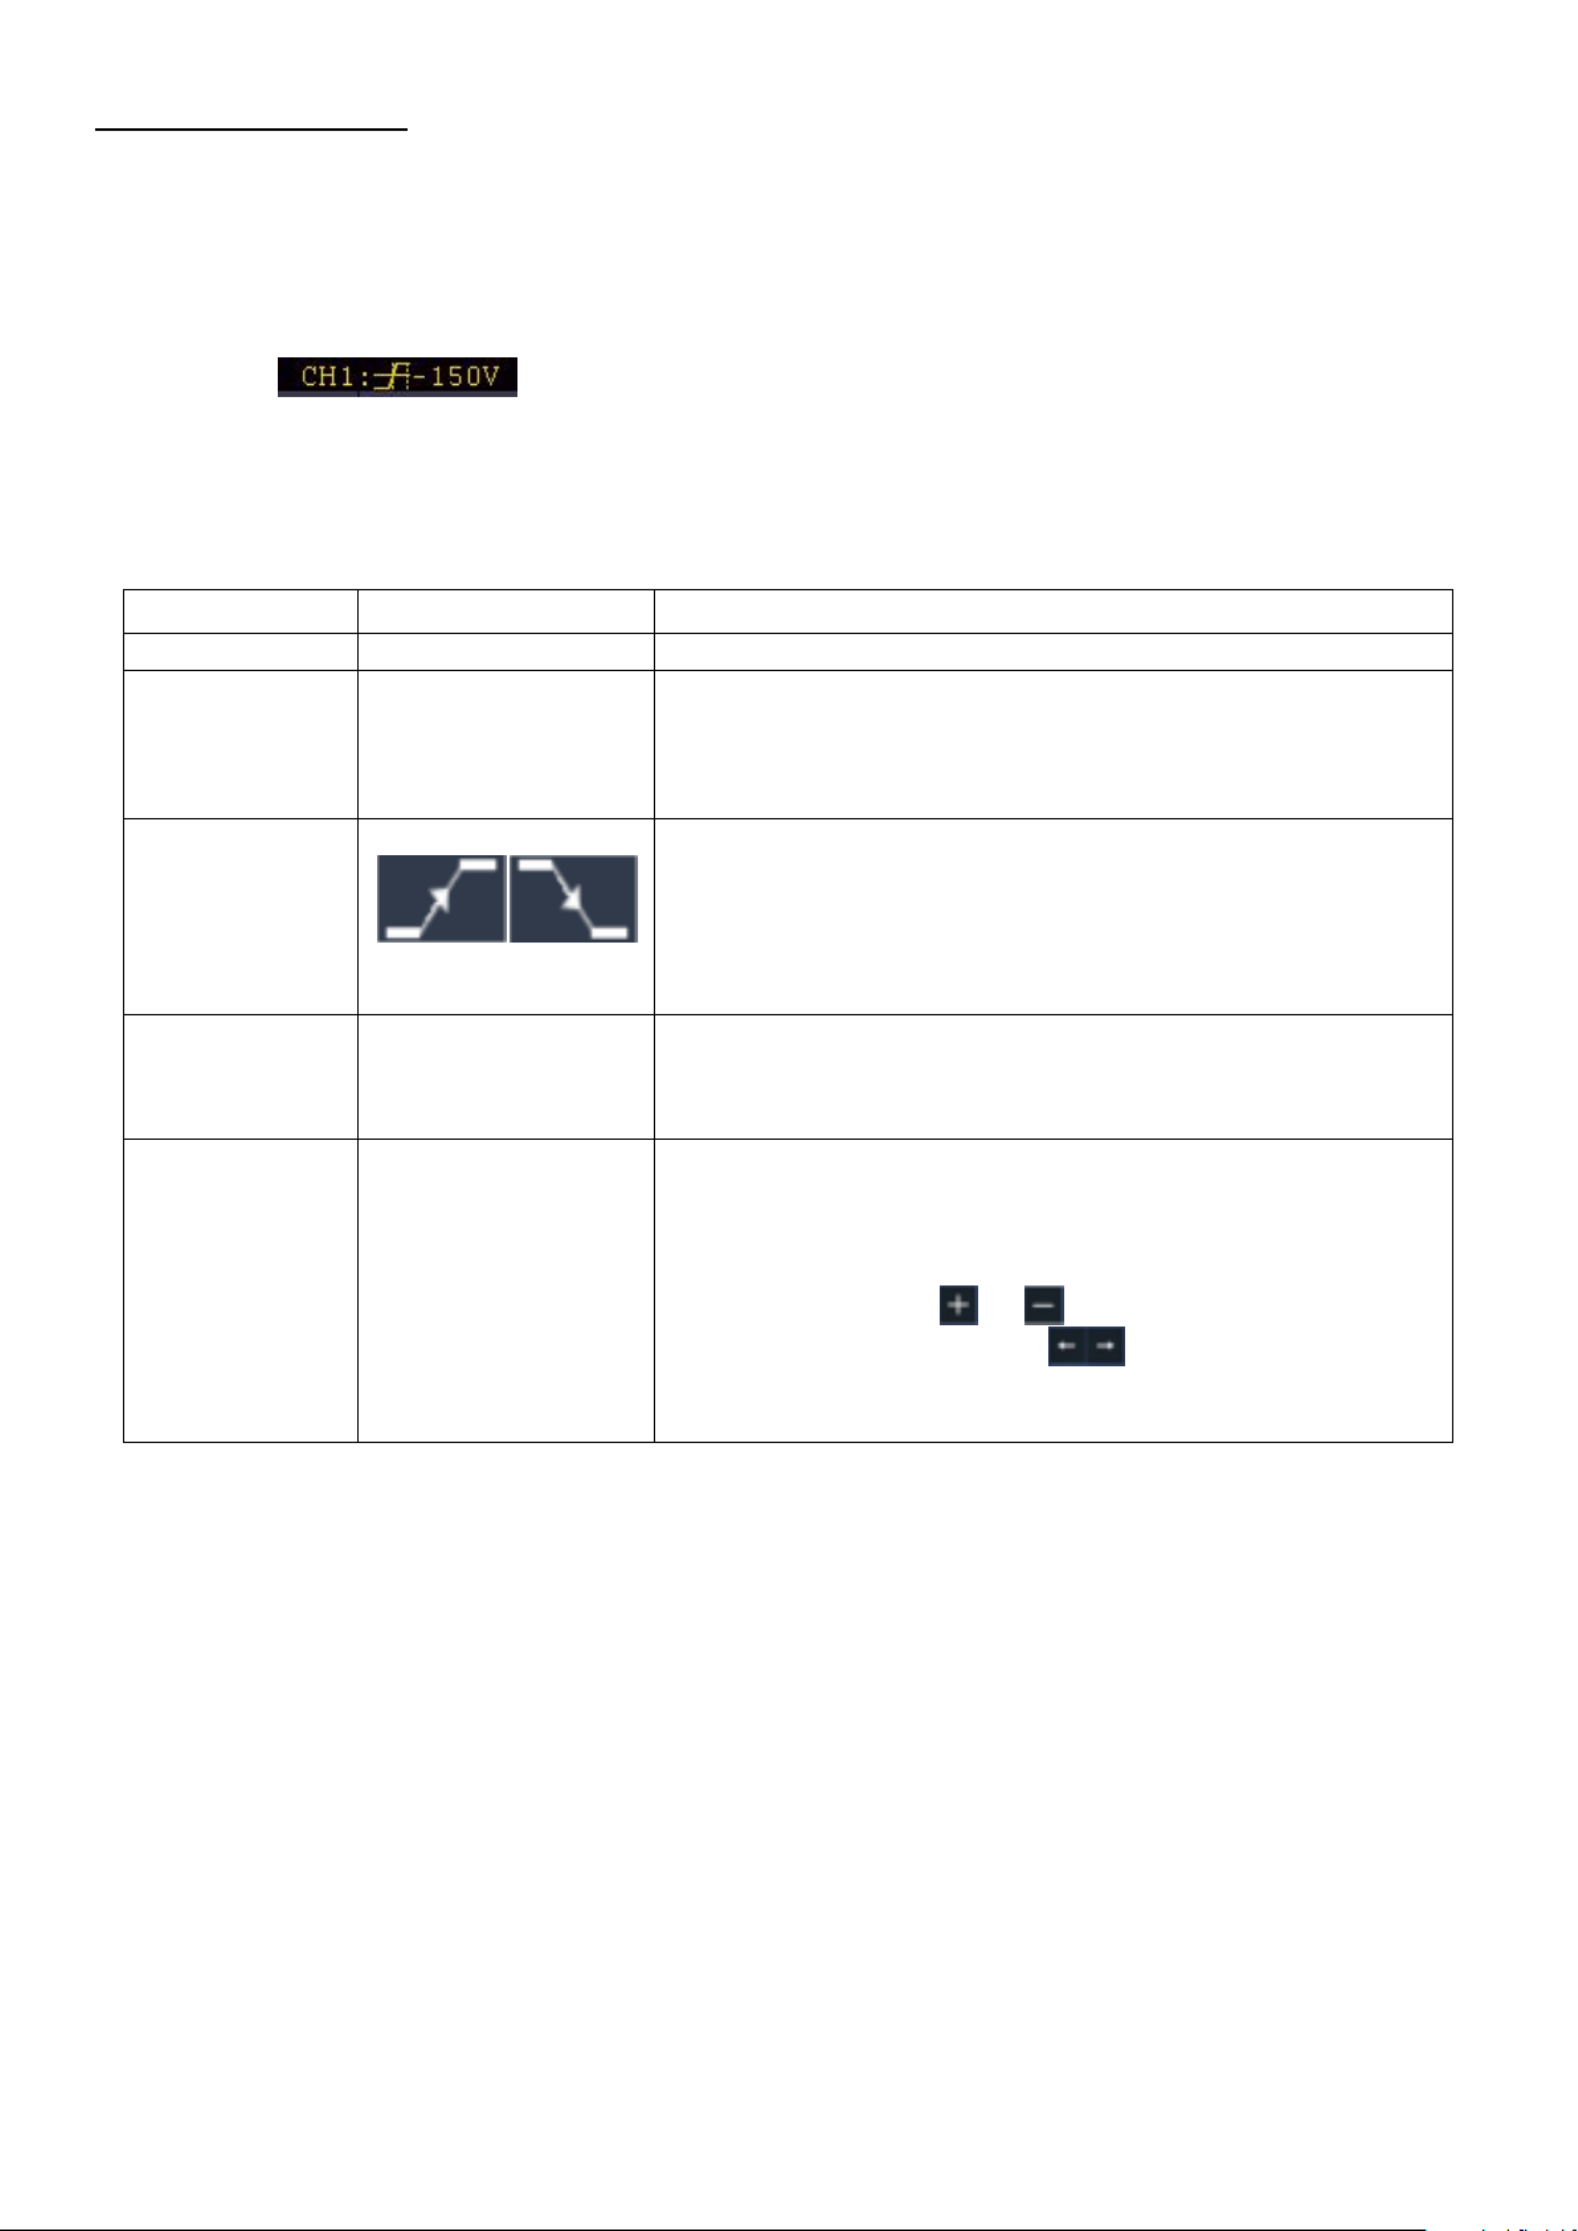
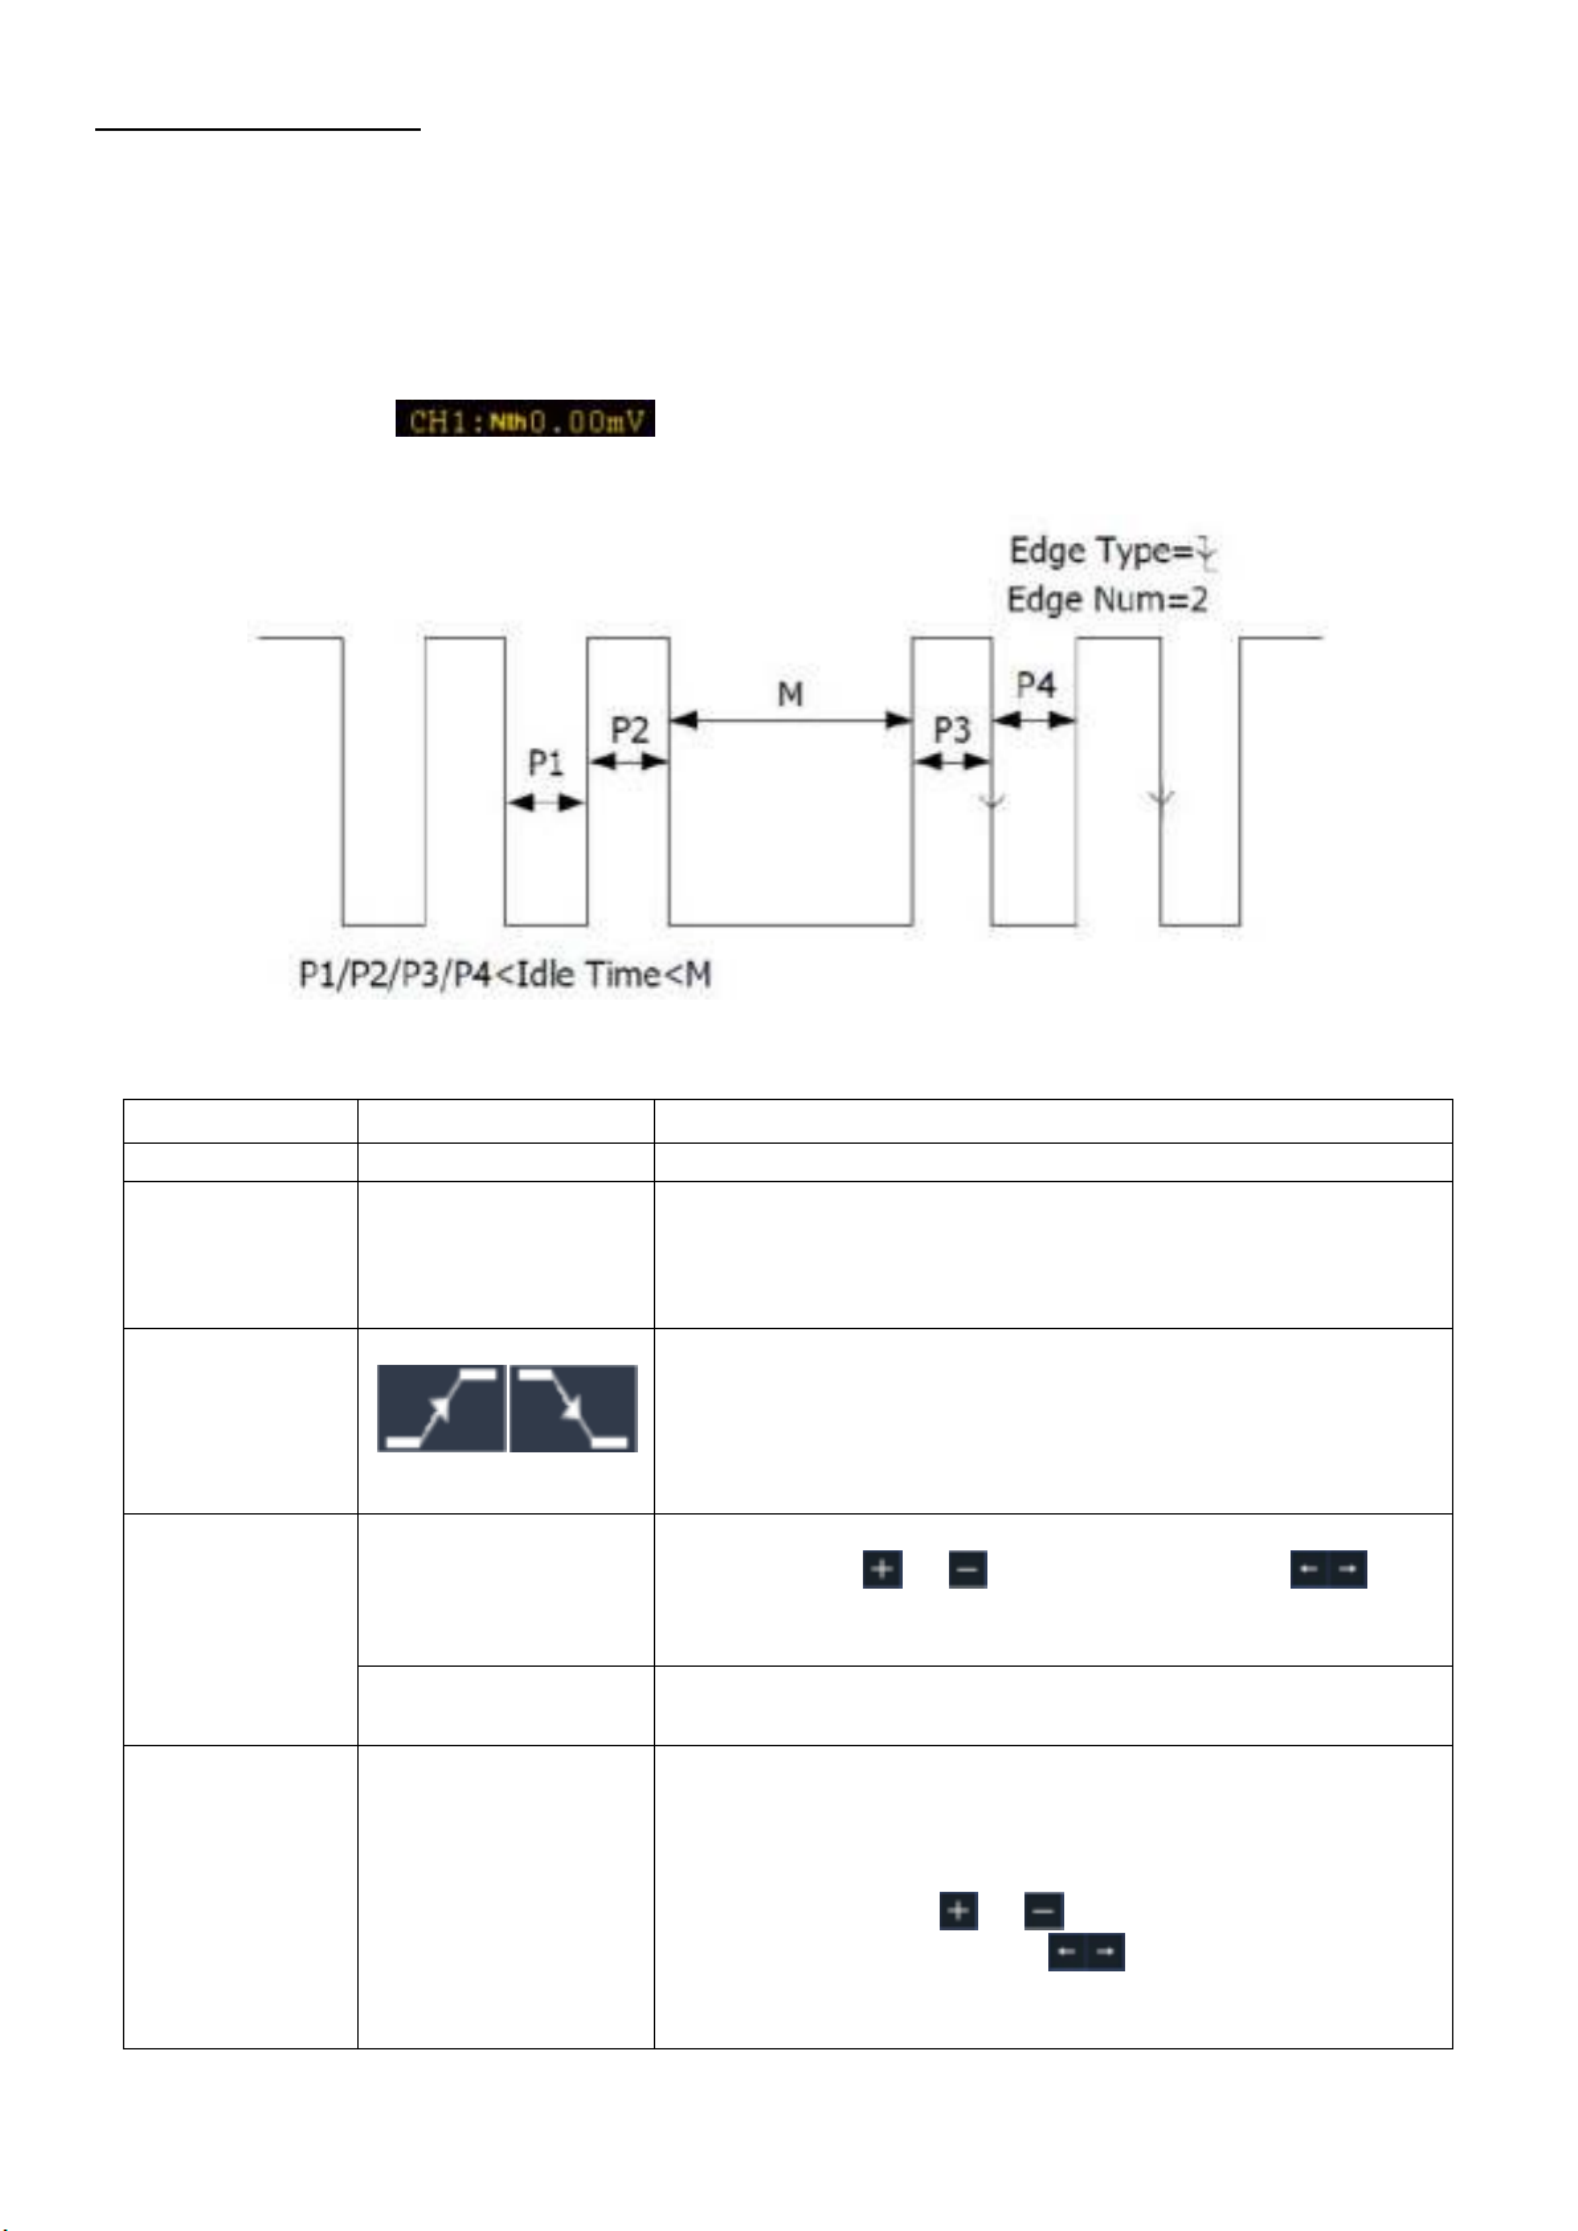
6.5.9 Nth edge trigger
The oscilloscope triggers on the Nth edge that appears on the specified idle time. As figure shown
below, the oscilloscope should trigger on the second falling edge after the specified idle time and
the idle time should be set to P1/P2/P3/P4 < Idle Time < M. Wherein, M, P1, P2, P3 and P4 are
positive or negative pulse width participating in the counting.
In Nth Edge Trigger mode, the trigger setting information is displayed on bottom right of the
screen, for example, , indicates that trigger type is Nth Edge, trigger source is
CH1, -150V is up level or low level threshold.
Nth trigger menu :
Menu
Settings
Description
Trigger Mode
Nth Edge
Set vertical channel trigger type as Nth Edge trigger.
Source
CH1
CH2
CH3
CH4
Select CH1 as the trigger source
Select CH2 as the trigger source
Select CH3 as the trigger source
Select CH4 as the trigger source
Polari ty
Edge
Trigger on the rising edge of the input signal when
voltage level meets the specified trigger level.
Trigger on the falling edge of the input signal when
voltage level meets the specified trigger level.
Configuration
Idle Time
Set idle time before the edge counting in Nth Edge
Trigger. Click or to set idle time, click to
move cursor to choose which digit to be set. Available
range is 30ns-10s, default 100ns.
Edge Num
Set the edge number value of “N” in Nth Edge trigger.
Mode
Holdoff
Auto
Normal
Single
Holdoff
Sensitivity
Acquire waveform even no trigger occurred
Acquire waveform when trigger occurred
When trigger occurs, acquire one waveform then stop
100 ns - 10 s, click or to set time interval before
another trigger occur, click to move cursor to
choose which digit to be set.
Set the trigger sensitivity.

- - 37
6.5.10 Logic trigger
Trigger according to logic relation.
In Logic Trigger mode, the trigger setting information is displayed on bottom right of the screen, for
example, , indicates that trigger type is Logic, logic mode
is AND, CH1 high level and trigger level is 0.00mV.
Logic trigger m u en :
Menu
Settings
Description
Trigger Mode
Logic
Set vertical channel trigger type as Logic trigger.
Logic Mode
AND
OR
XNOR
XOR
Set logic mode as AND.
Set logic mode as OR.
Set logic mode as XNOR.
Set logic mode as XOR.
Input Mode
CH1
CH2
CH3
CH4
Set CH1 as High Level, Low level, high or low level,
Rise and Fall.
Set CH2 as High Level, Low level, high or low level,
Rise and Fall.
Set CH3 as High Level, Low level, high or low level,
Rise and Fall.
Set CH4 as High Level, Low level, high or low level,
Rise and Fall.
Note
:
:
:
::
When input mode of one channel is set as Rise
or Fall, the other channel could not be set as Rise and
Fall at the same time.
Out Mode
Goes True
Goes False
Is True>
Is True<
Is True=
Trigger when condition turns True from False.
Trigger when condition turns False from True.
Trigger when the time of true condition is greater than
the set time
Trigger when the time of true condition is equal to the
set time
Trigger when the time of true condition is lower than
the set time
Mode
Holdoff
Auto
Normal
Single
Holdoff
Sensitivity
Acquire waveform even no trigger occurred
Acquire waveform when trigger occurred
When trigger occurs, acquire one waveform then stop
100 ns - 10 s, click or to set time interval before
another trigger occur, click to move cursor to
choose which digit to be set.
Set the trigger sensitivity.
Note: If a channel is set as “Rise” or “Fall”, the other channel cannot be set as “Rise” or “Fall” at
the same time
- - 38
6.5.11 Bus trigger
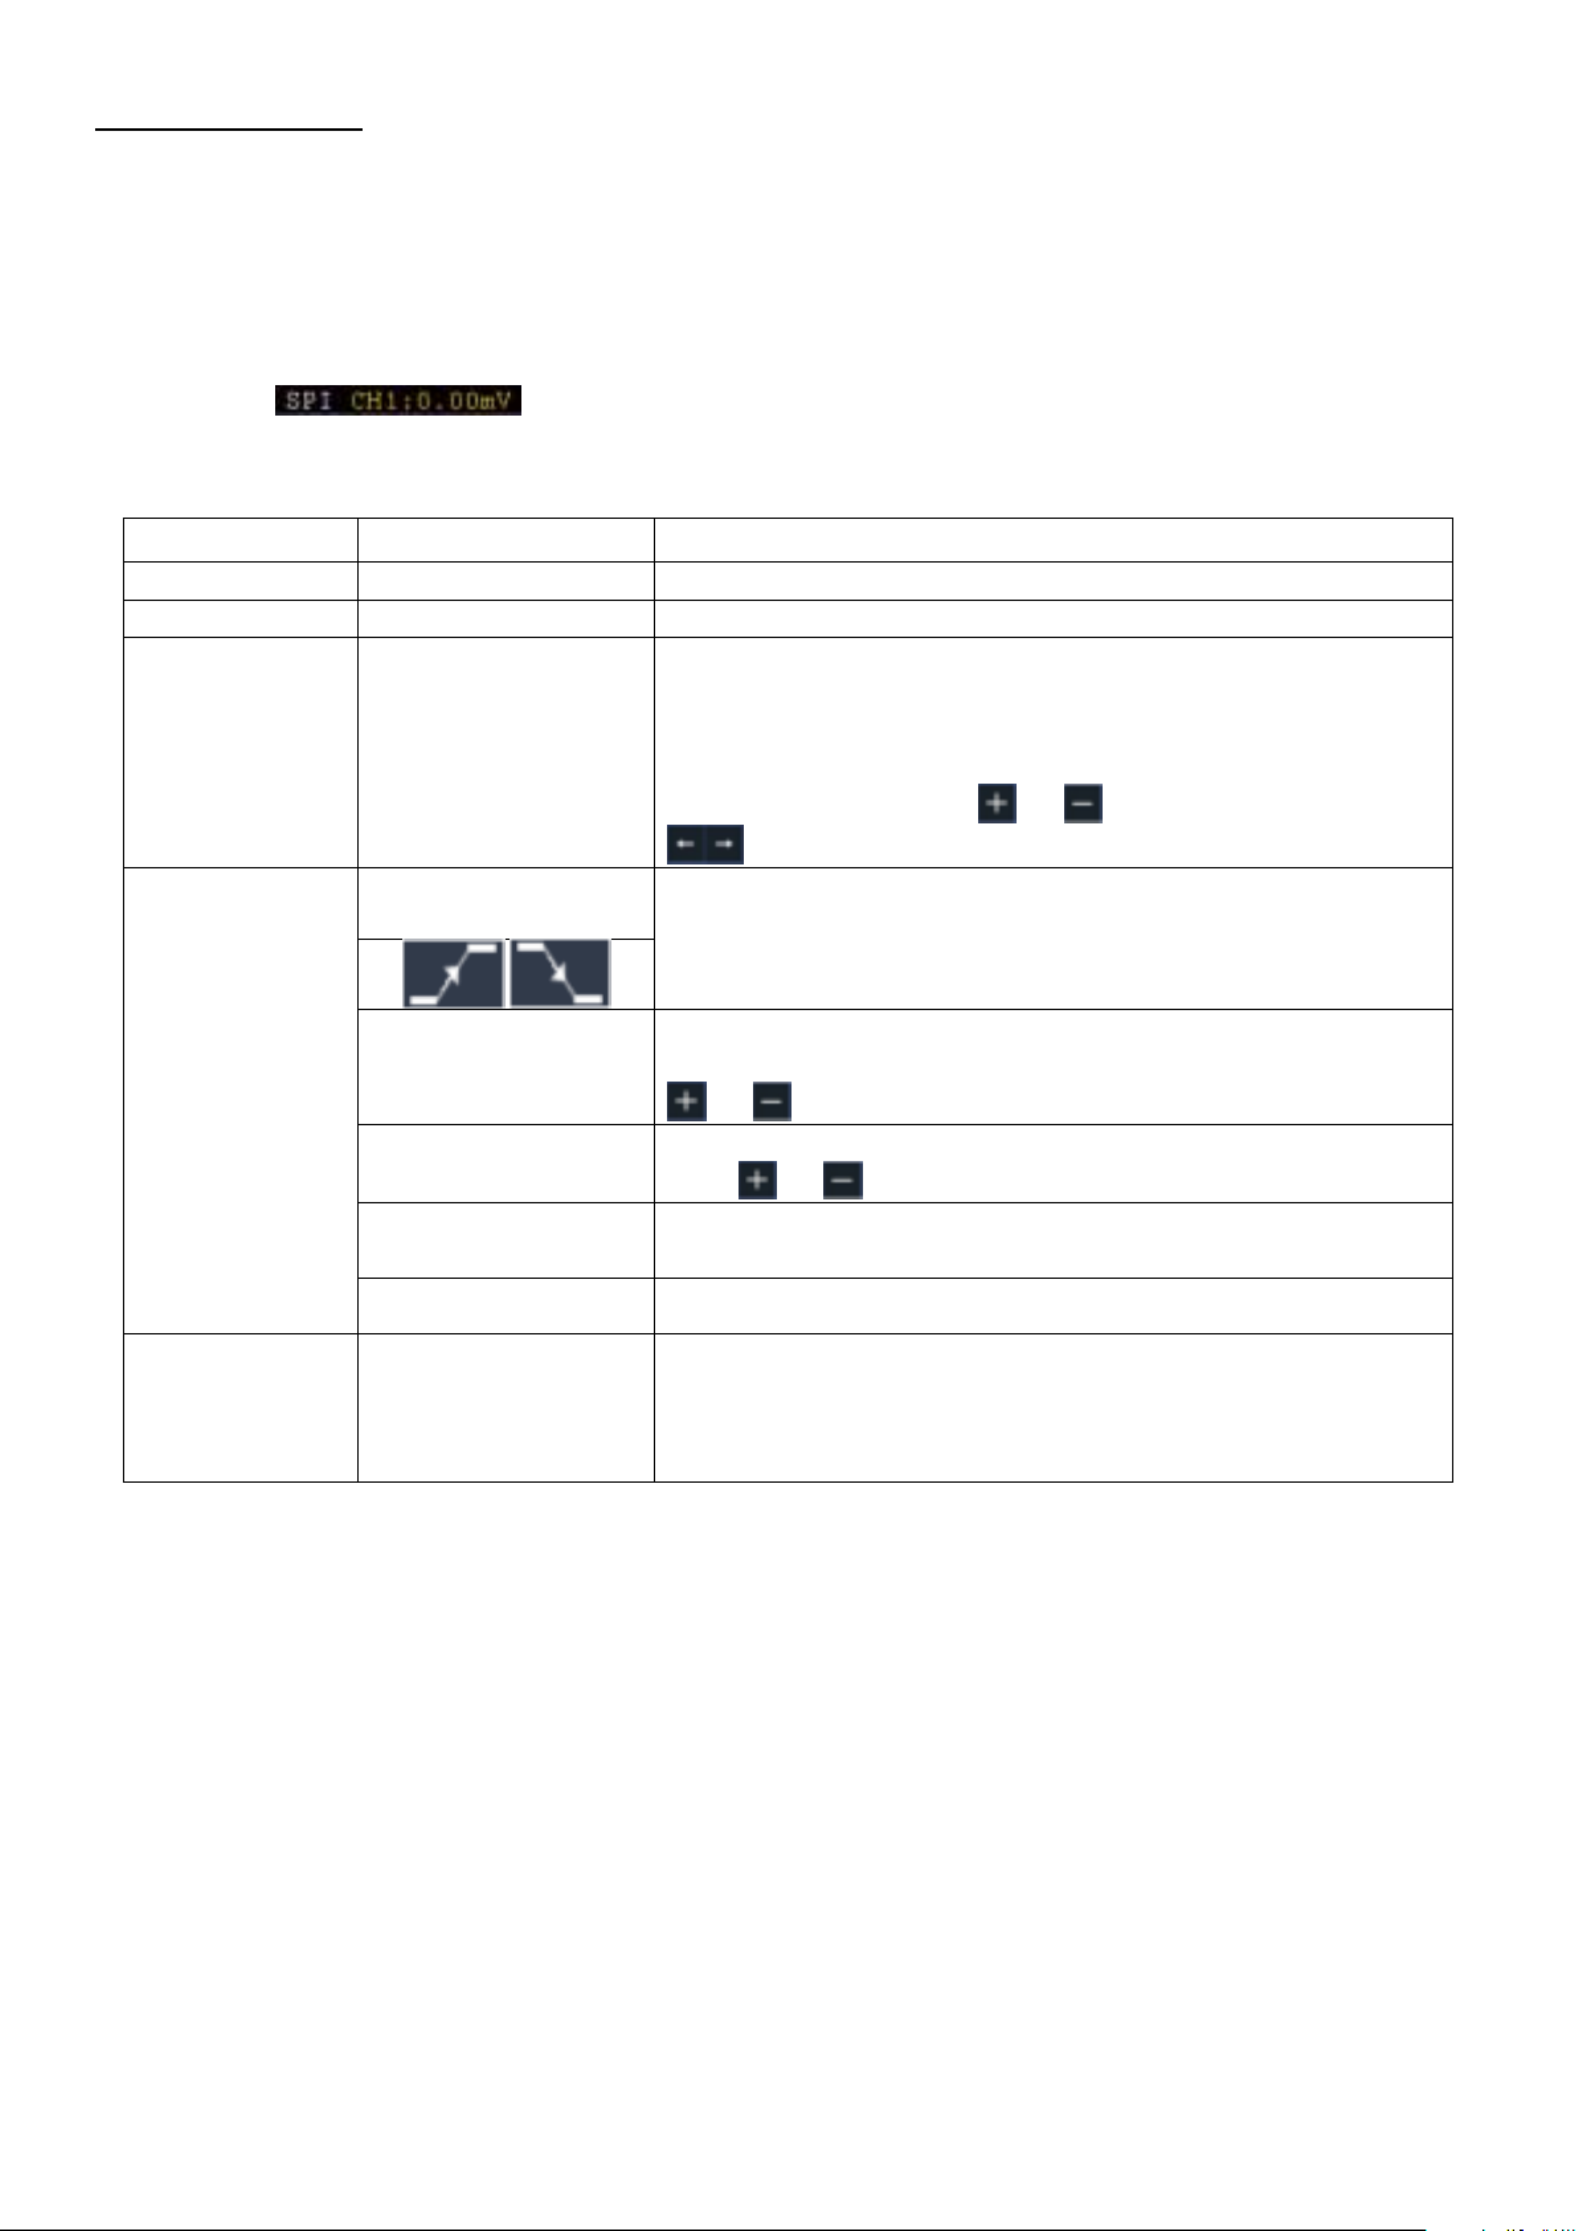
1. SPI
Trigger on the specified data when the timeout condition is meet. When using SPI trigger, you
need to specify the SCL and SDA data sources.
In SPI bus trigger mode, the trigger setting information is displayed on bottom right of the screen,
for example, indicates that trigger type is SPI, CH1 trigger level is 0.00mV. ,
Menu
Settings
Description
Bus Type
SPI
Vertikaler Bus-Typ als SPI-Triggerung festlegen
Source
SCL
Set SCL
Timeout
Time out
Set the minimum time that SCL must be idle, that is a
period of SCL, available range 100ns-10s. Time out
means SCL keeps idle for a specified time before
oscilloscope starts to search for the data (SDA) on
which to trigger. Click or to set time out, click
to move cursor to choose which digit to be set.
ClockEdge &
Data
Clock Edge
Set Clock Edge as rising edge or falling edge. Means
sample the SDA data on the rising edge or falling edge
of the clock.
Data Bits
Set the number of bits of the serial data character
string. It can be set to any integer between 4-32. Click
or to set Data Bits.
Current Bits
Set the number of the data bits, ranges from 0-31,
click or to set Current Bit.
Data
Set the value of the current data bit as H, L, or X
(H or L).
All Bits
Set all the data bits to be the specified value in Data.
Mode
Holdoff
Auto
Normal
Single
Acquire waveform even no trigger occurred
Acquire waveform when trigger occurred
When trigger occurs, acquire one waveform then stop
- - 39
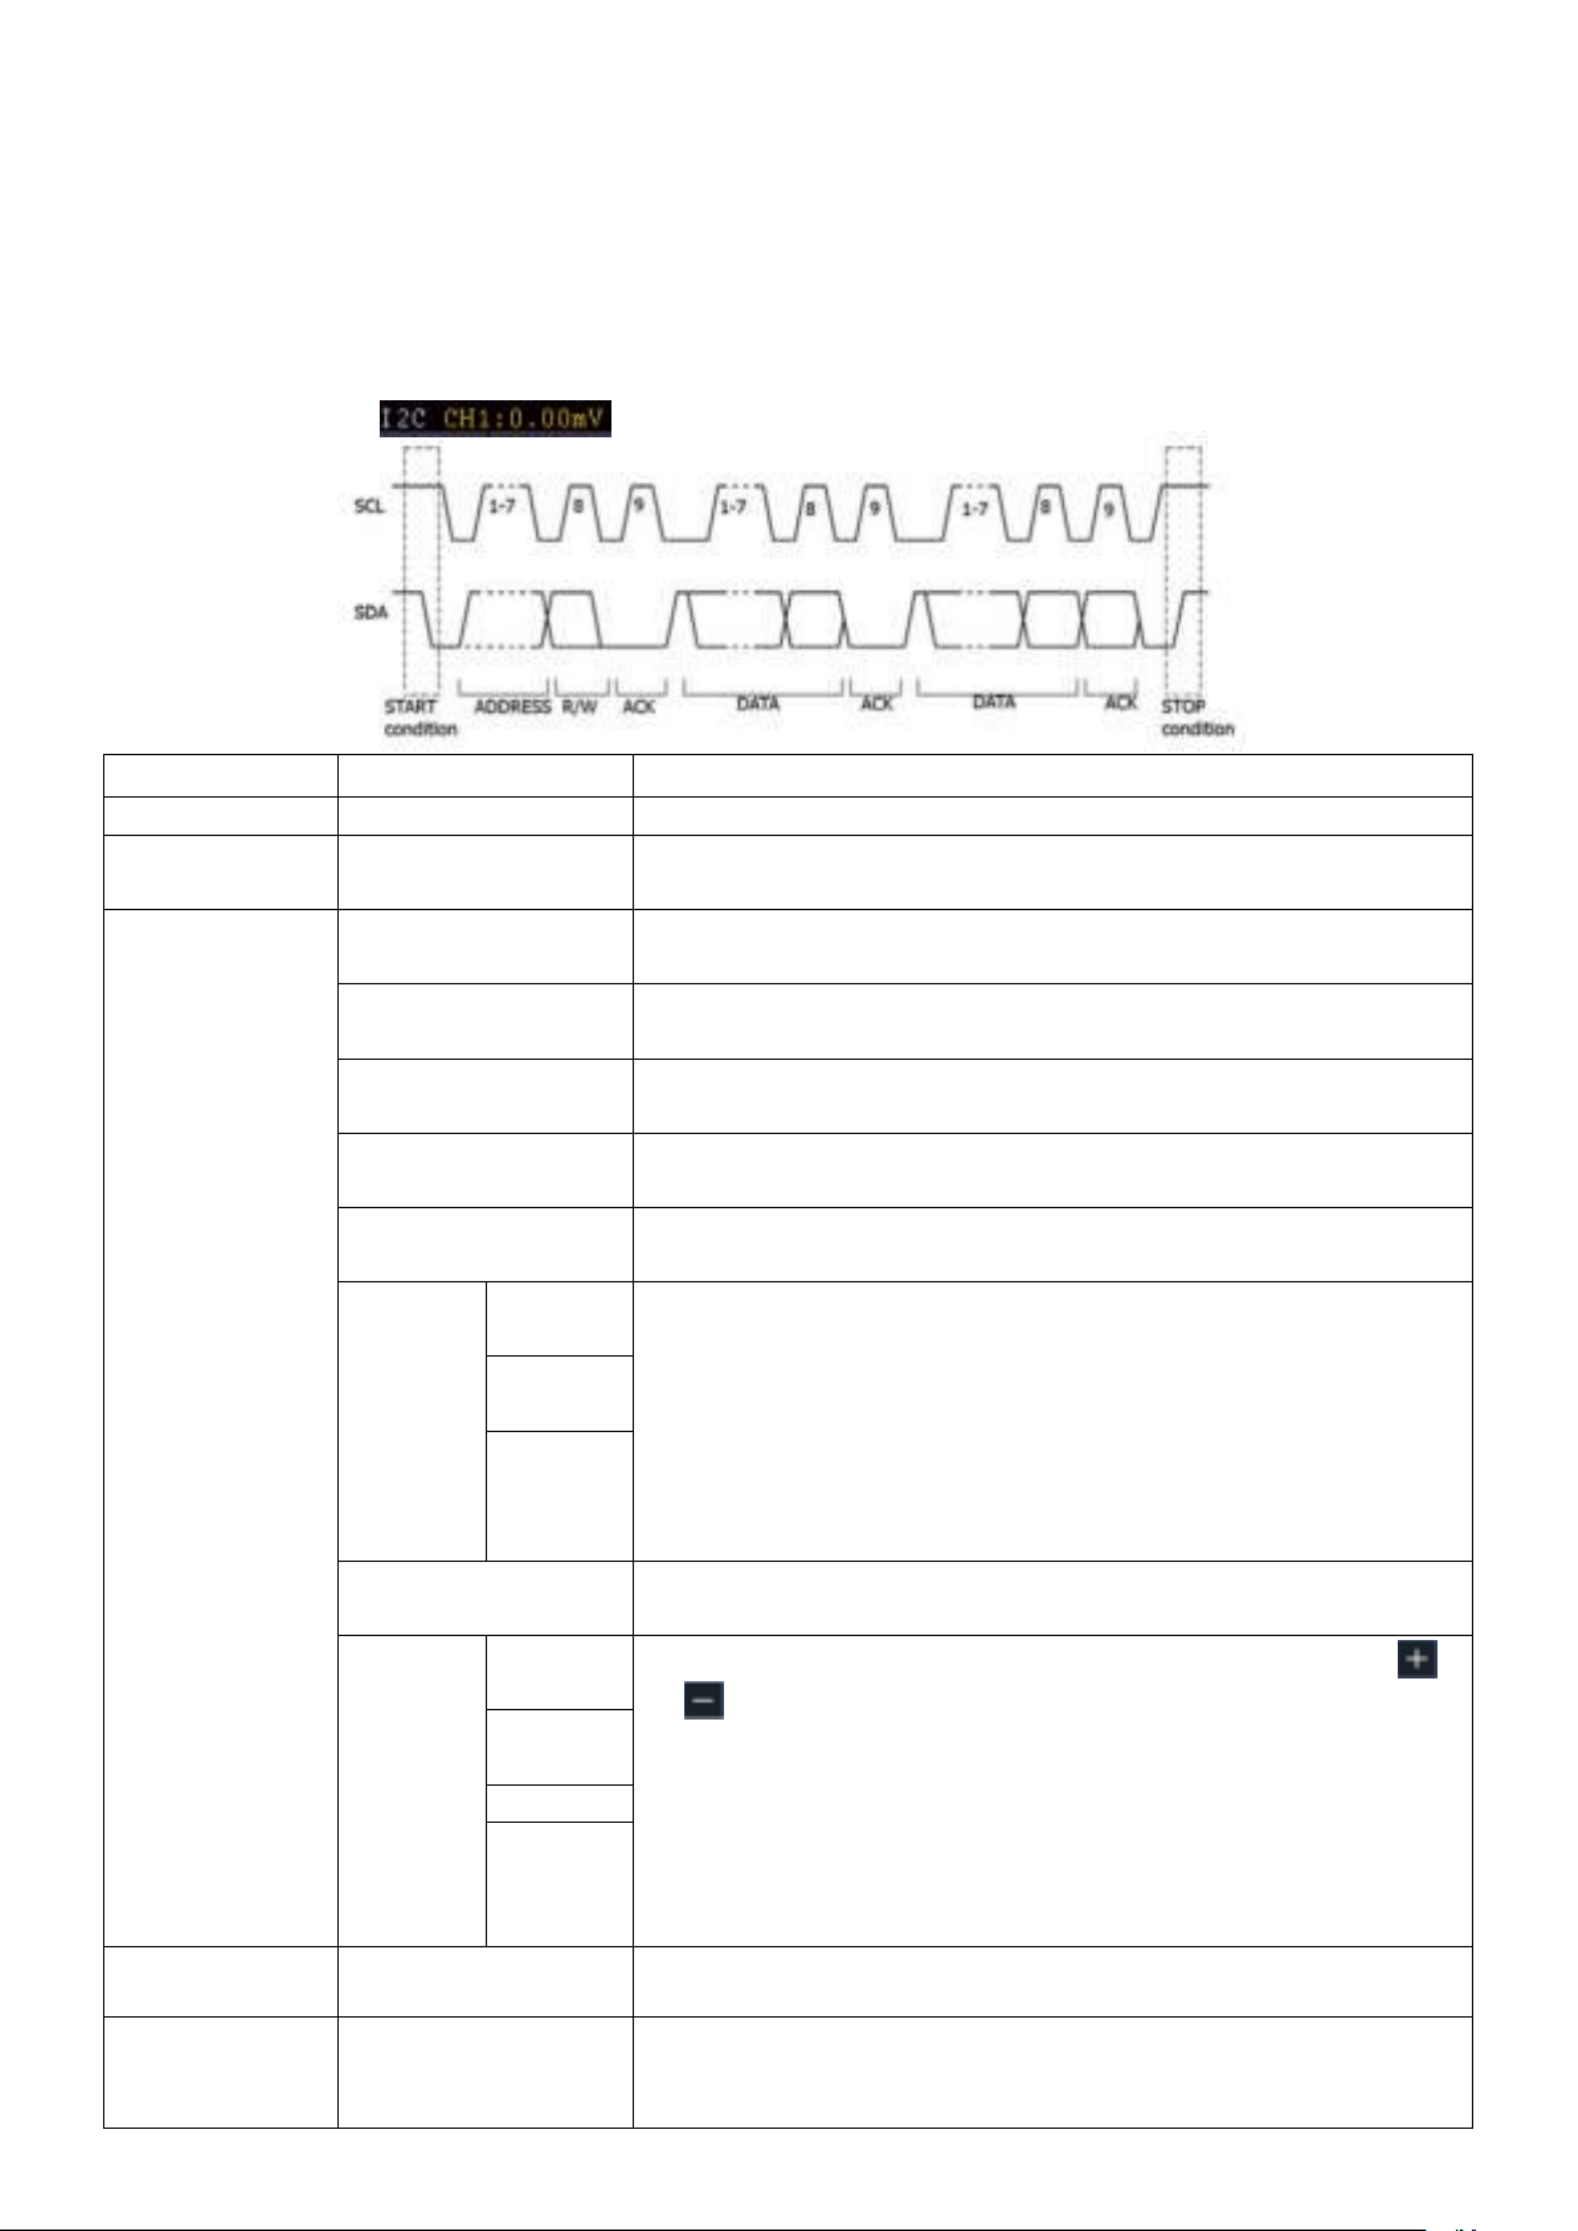
2. I2C trigger
The I2C serial bus consists of SCL and SDA. The transmission rate is determined by SCL, and the
transmission data is determined by SDA. As shown in below figure, oscilloscope can trigger on the
start, restart, stop, ack lost, specific device address or data value, also device address and data
value at the same time.
In I2C bus trigger mode, the trigger setting information is displayed on bottom right of the
screen,for example, , indicates that trigger type is I2C, CH1 trigger level is
0.00mV.
Menu
Settings
Description
Bus Type
I2C
Set vertical channel bus type as I2C trigger.
Source
SCL
SDA
Set SCL.
Set SDA.
When
Start
Trigger when SDA data transitions from high to low while
SCL is high.
Restart
When another start condition occurs before a stop
condition.
Stop
Trigger when SDA data transitions from low to high while
SCL is high.
Ack Lost
Trigger when SDA data is high during any
acknowledgement of SCL clock position.
Address
Trigger on the read or write bit when the preset address
is met.
Adr
Format
Addr
Bits
Set Address Bits to be , “7” “8” or “10”.
Set address according to the preset address bits,
address range is 0-127, 0-255, 0-1023 respectively.
Set Data Direction to be or . Write Read
Note: The set is not available when Address bits is set to
“8”.
Address
Directio
n
Data
Search for the preset data value on SDA and trigger on
the dump edge of SCL of the last bit of the data area.
Data
Format
Byte
length
Set data byte length, available range 1-5 bytes. Click
or to set byte length.
Select the data bit, ranges from 0 to (byte length*8 -1).
Set data to be H, L, or X (H or L)
Set all the data bits to be the specified value in Data
Current
Bit
Data
All Bits
Addr / Da ta
Set all the data bits to be the specified value in Data
Mode
Holdoff
Auto
Normal
Single
Acquire waveform even no trigger occurred
Acquire waveform when trigger occurred
When trigger occurs, acquire one waveform then stop
- - 40
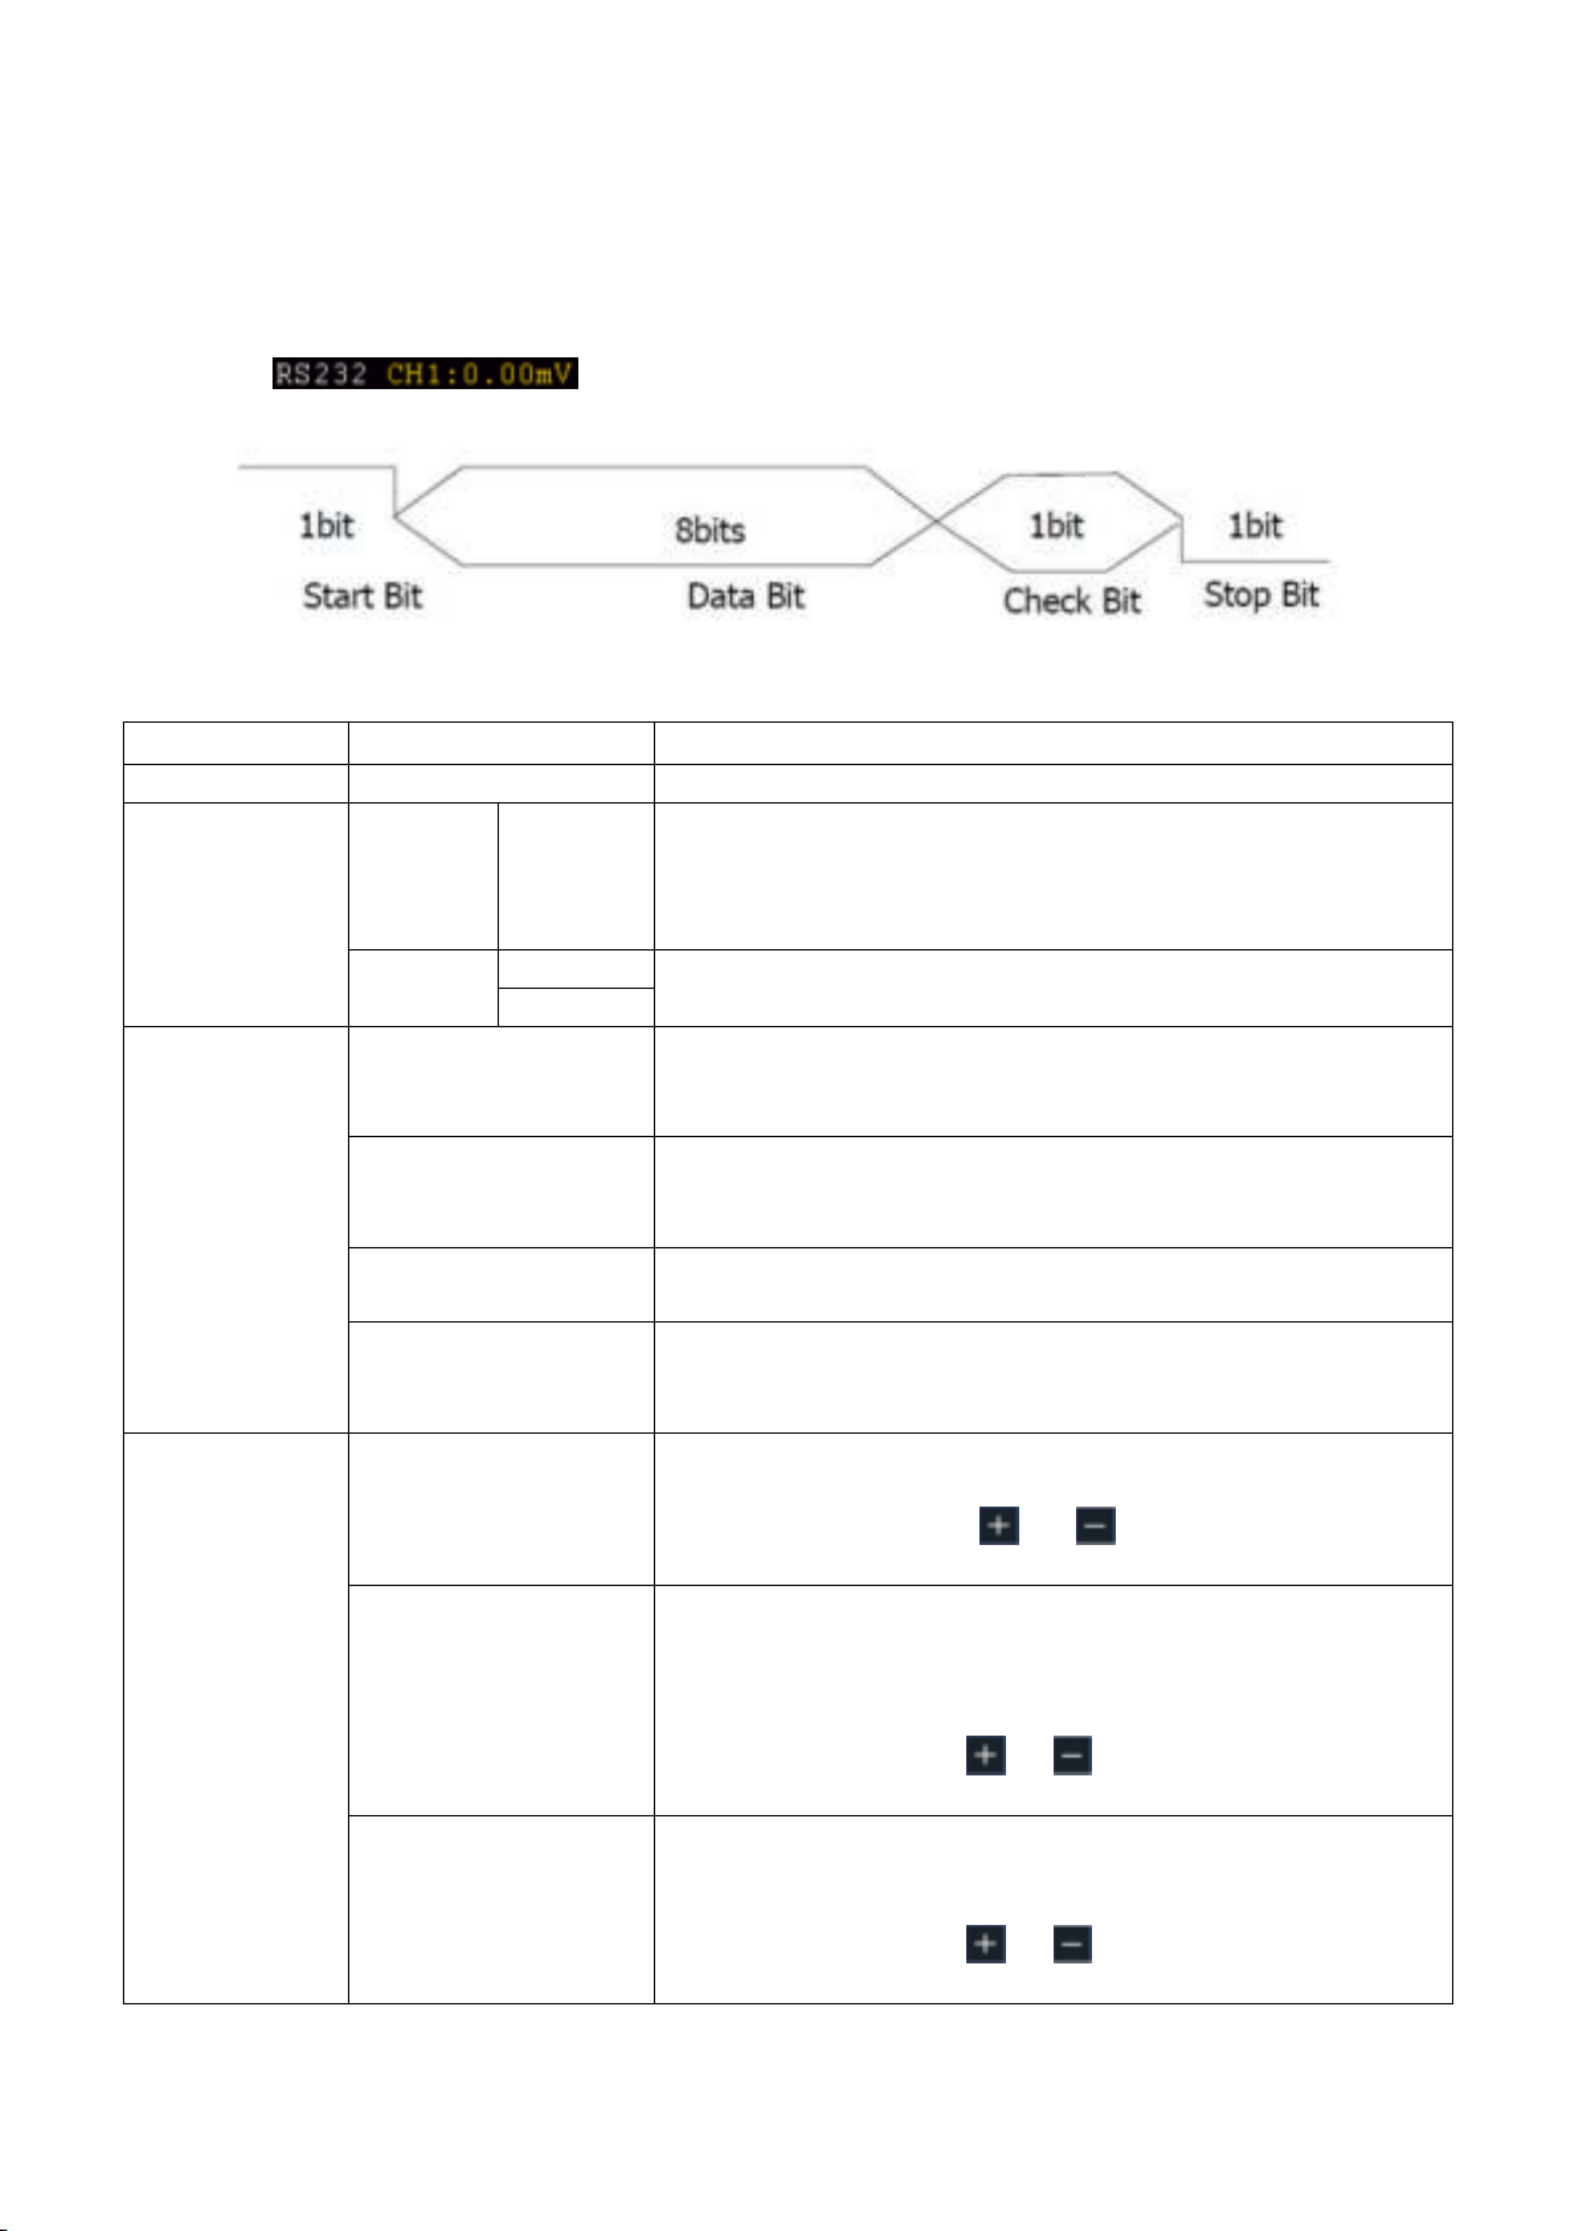
3. RS232 trigger
RS232 is a serial communication mode used in the data transmission between PCs or between
PC and Terminal. A character is transmitted as a frame of data which consist of 1bit start bit, 5-
8bits data bits, 1bit check bit and 1-2 stop bits.
In RS232 bus trigger mode, the trigger setting information is displayed on bottom right of the screen,
for example, , indicates that trigger type is UART, CH1 trigger level is 0.00mV.
Menu
Settings
Description
Bus Type
RS232
Set vertical channel bus type as RS232 trigger.
Input
Source
CH1
CH2
CH3
CH4
Select CH1 as the trigger source
Select CH2 as the trigger source
Select CH3 as the trigger source
Select CH4 as the trigger source
Polarity
Normal
Select polarity of data transmission as Normal.
Select polarity of data transmission as Inverted.
Inverted
W hen
Start
Trigger on the start frame of position. After choosing
this condition, press Configure to enter detailed
settings.
Error
Trigger when error frame is detected. After choosing
this condition, press Configure to enter detailed
settings.
Chk Error
Trigger when Chk Error is detected. After choosing this
condition, press Configure to enter detailed settings.
Data
Trigger on the last bit of the preset data. After choosing
this condition, press Configure to enter detailed
settings.
Configuration
Start
Common Baud: click in the left menu to choose
common baud.
Custom Baud: click or choose baud, ranges
from 50 to 10,000,000.
Error
Stop Bit:Select “1” or ”2”.
Parity: Select None, Odd, or Even
Common Baud: click in the left menu to choose
common baud.
Custom Baud: click or to choose baud, ranges
from 50 to 10,000,000.
Chk Error
Parity: Select Odd or Even.
Common Baud: click in the left menu to choose
common baud.
Custom Baud: click or to choose baud, ranges
from 50 to 10,000,000.
- - 41
Data
Data Bits: Set as 5, 6, 7, 8 bits.
Data:Set data according to data bits, ranges from 0-
31, 0-63, 0-127 or 0-255.
Common Baud: click in the left menu to choose
common baud.
Custom Baud: click or to choose baud, ranges
from 50 to 10,000,000.
Mode
Holdoff
Auto
Normal
Single
Acquire waveform even no trigger occurred
Acquire waveform when trigger occurred
When trigger occurs, acquire one waveform then stop
7. Sampling Setup
Click to call up the menu panel. Click the Acquire softkey on pane Acqu Mode Length PERF l, , ,
Mode, and Intrpl is shown in the bottom menu.
Description of the Acqu Mode menu
Menu
Settings
Description
Acqu Mode
Sample
Normal sampling mode.
Peak detect
Use to capture maximal and minimal
samples. Finding highest and lowest
points over adjacent intervals. It is used
for the detection of the jamming burr
and the possibility of reducing the
confusion.
Average
4, , ,128 16 64
It is used to reduce the random and
don't-care noises, with the optional
number of averages.
Refresh Rate
Low
Set the waveform refresh rate, you can
turn on this mode when you need to
observe a single waveform
Description of the record length menu:
Menu
Settings
Description
Länge
1000
Choose the record length
Note: When four channels are turned on, the max record
length is 10M; max 20M for two channels; and max 40M
for one channel.
10K
100K
1M
10M
20M
40M
Description of the Intrpl menu :
Menu
Settings
Description
Intrpl
Sinx/x
Use sine(x)/x interpolation
Use linear interpolation
x
- - 42
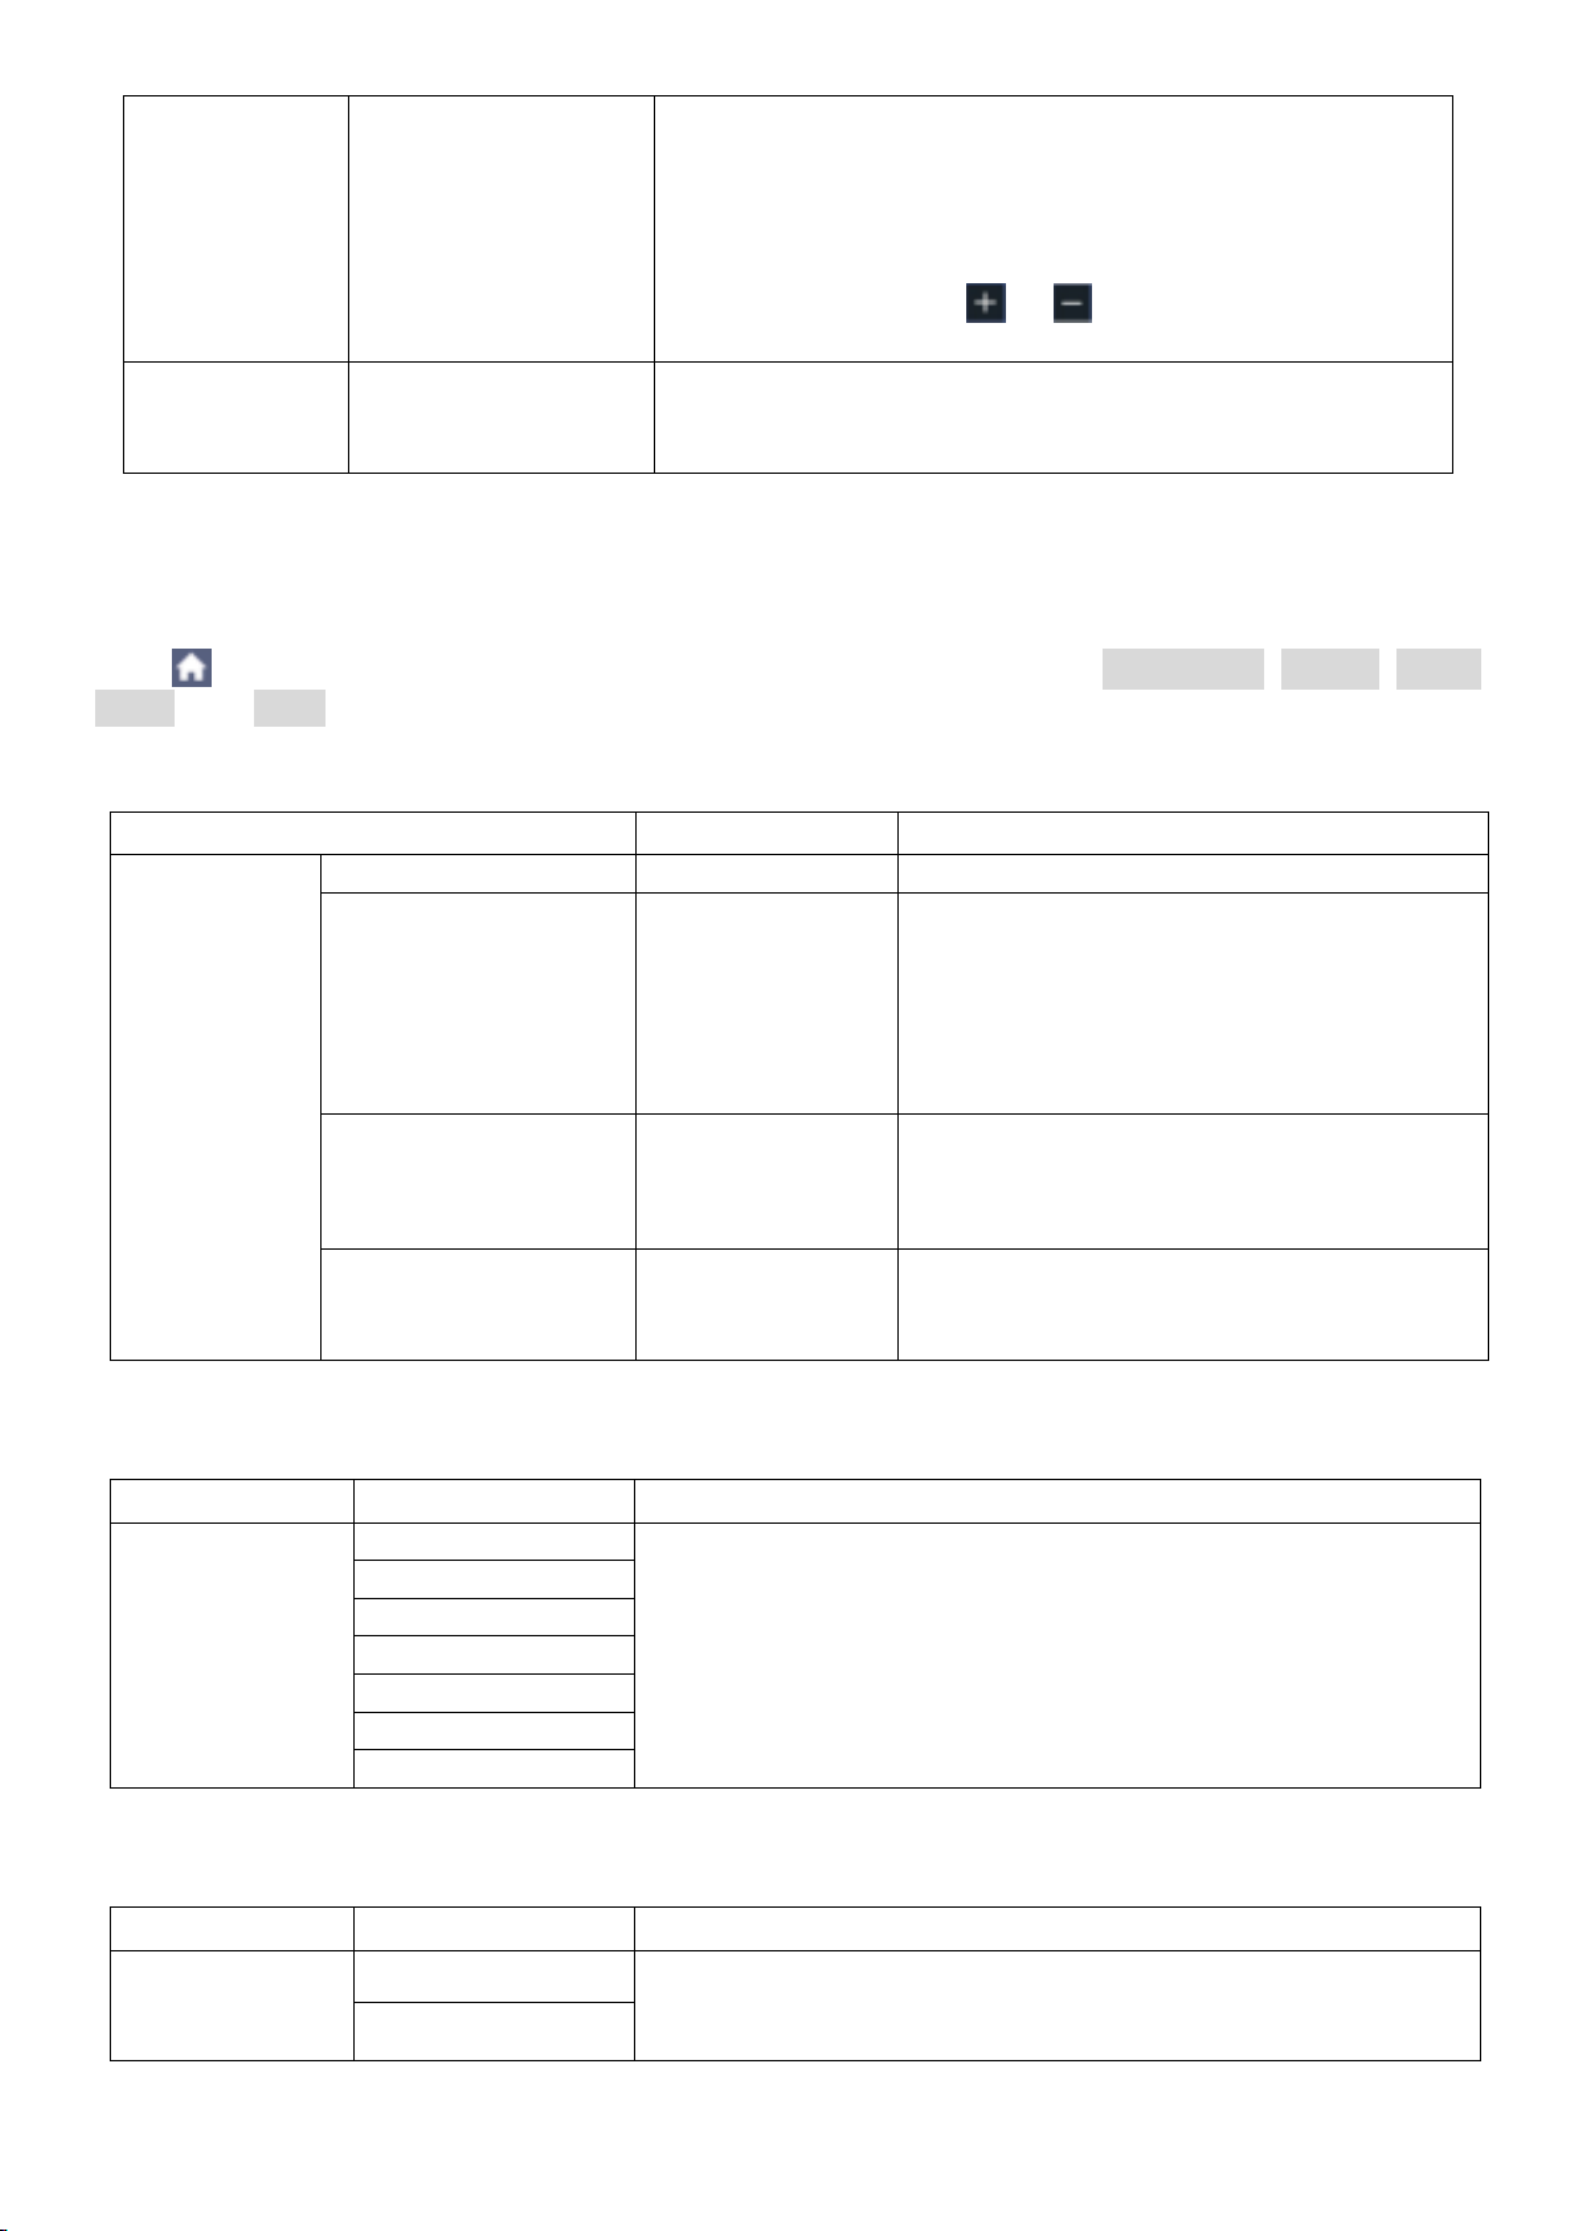
Interpolation method is a processing method to connect the sampled points, using some points to
calculate the whole appearance of the waveform. Select the appropriate interpolation method
according to the actual signal.
Sine(x)/x interpolation: Connect the sampled points with curved lines.
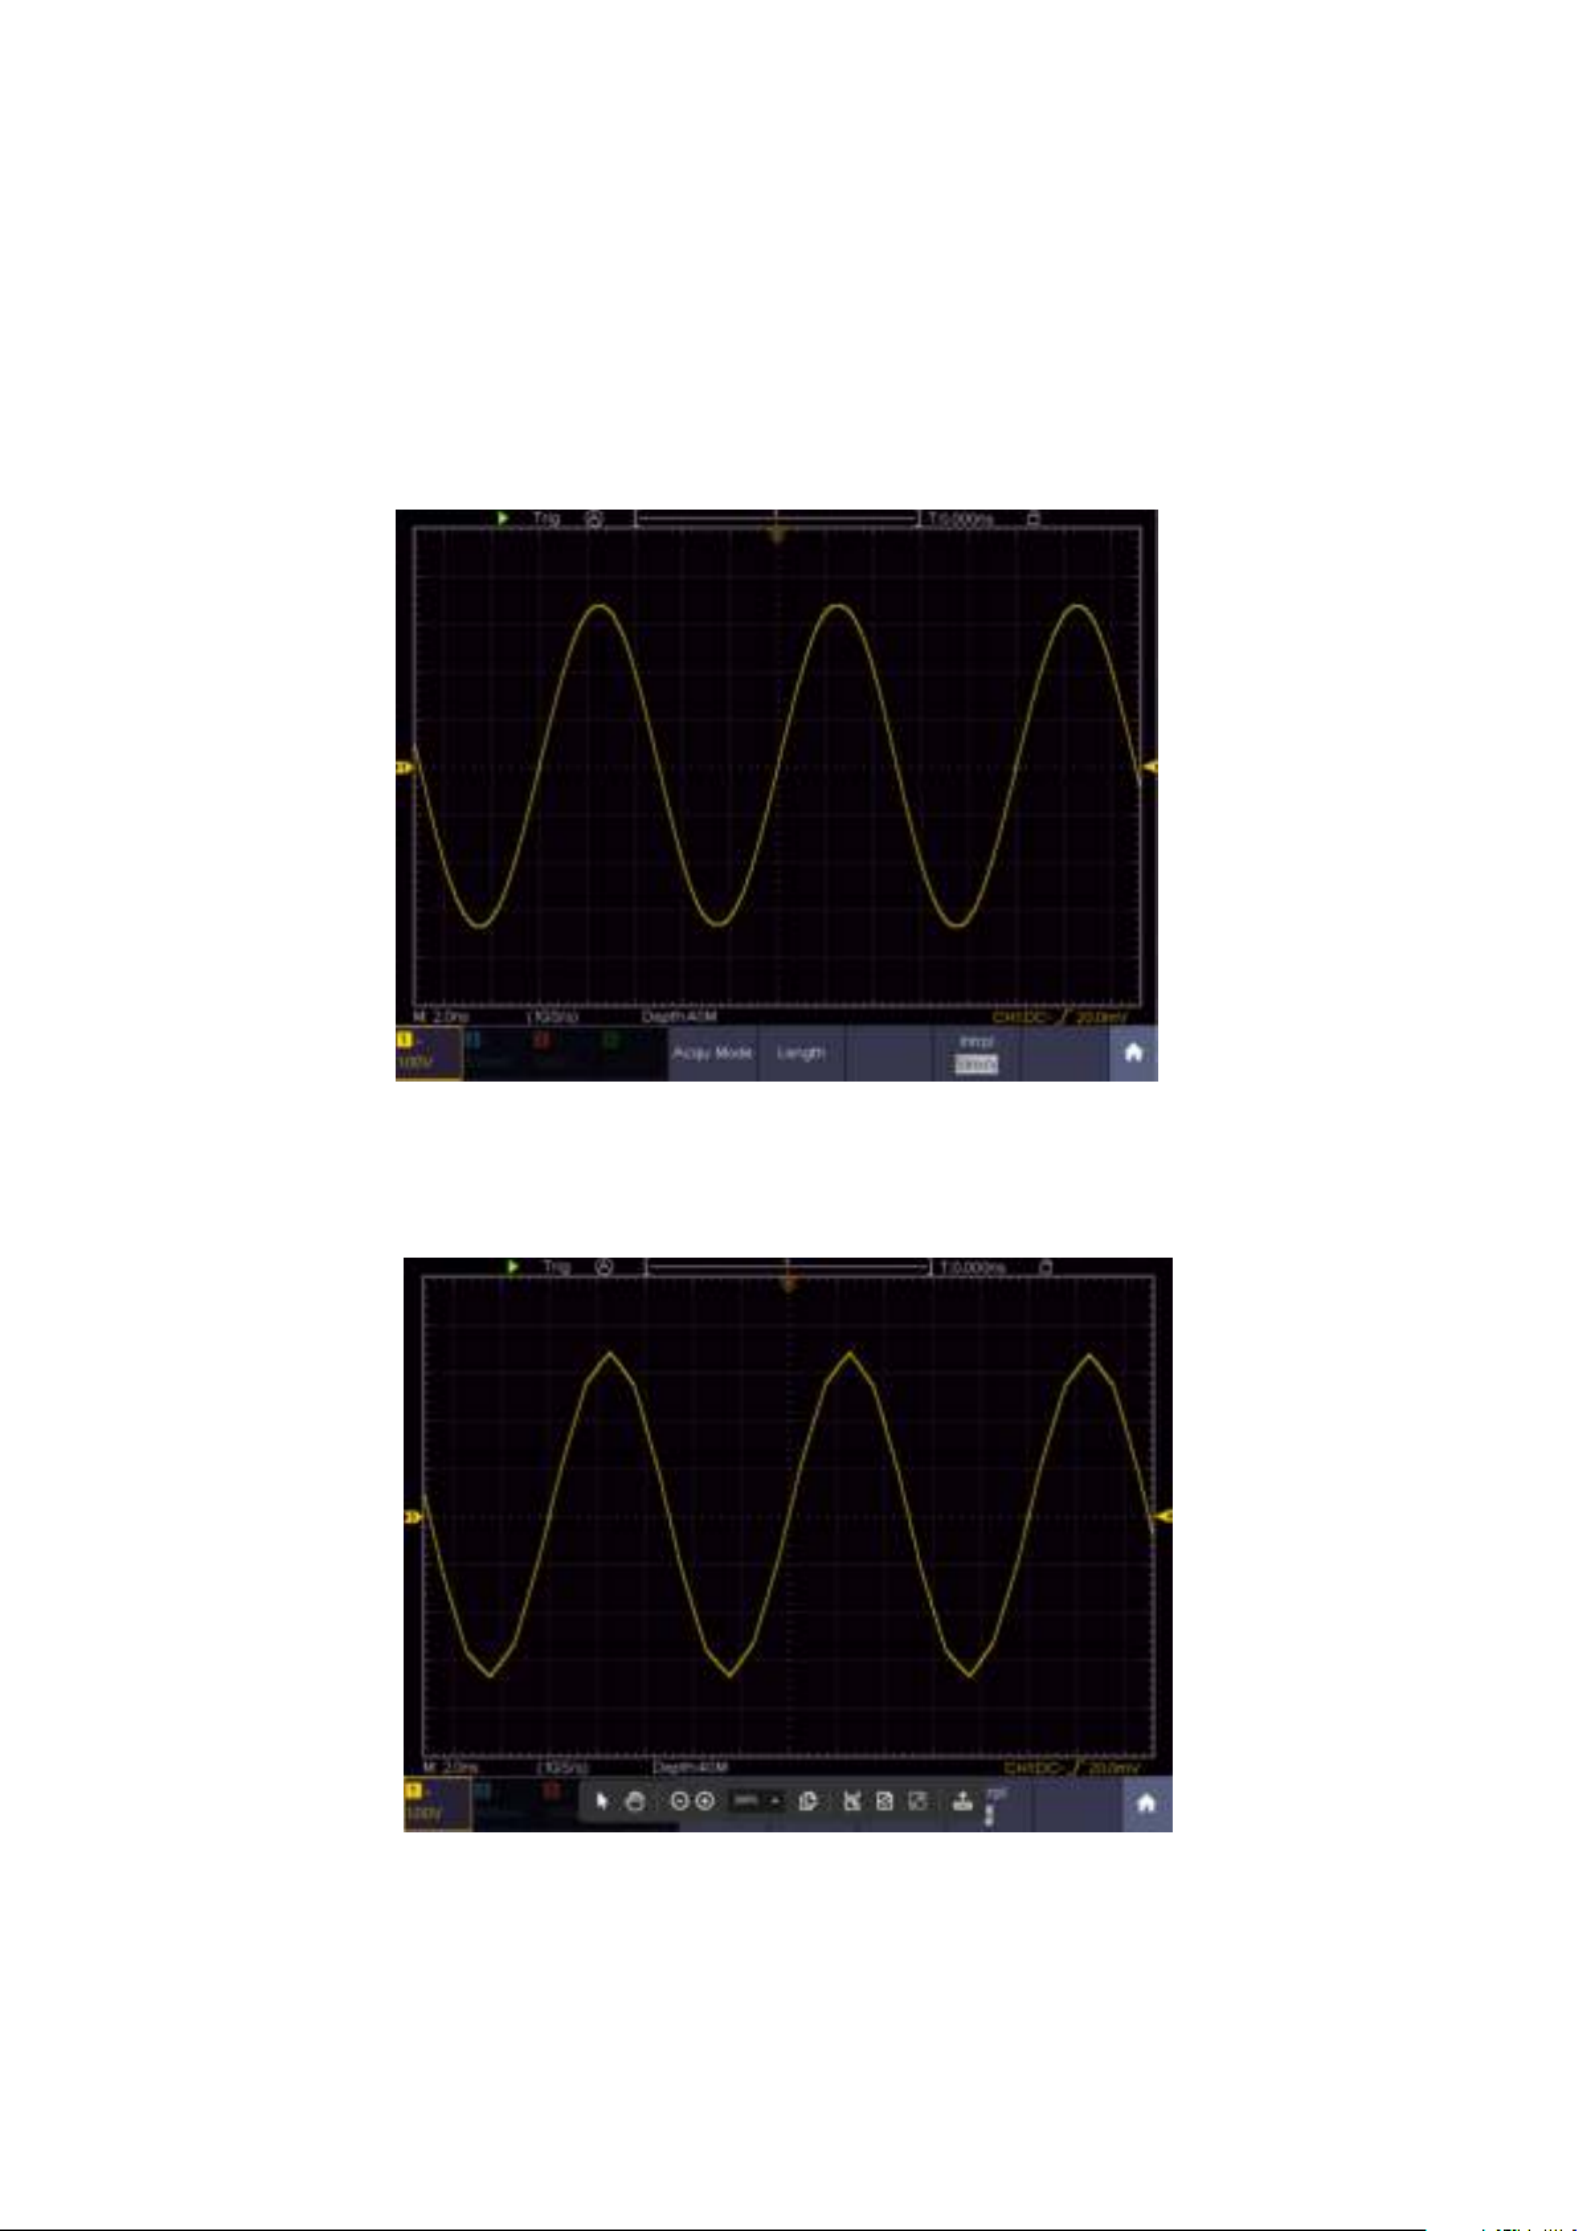
Linear interpolation: Connect the sampled points with straight lines. This method is suitable to
rebuild the straight-edged signals, such as square or pulse wave.
Figure 4.1 Sine(x)/x interpolation
Figure 4.2 Linear interpolation
- - 43
8. Implementation of the function setting for the auxiliary system
Configuration
Click to call up the menu panel. Click the Utility softkey on panel, select Function in the
bottom menu, select Configure in the left menu.
The description of is shown as the follows: Configure Menu
Menu
Settings
Description
Language
Choose the display language of the operating
system.
Set time
Display
ON
OFF
On/Off the date display
Hour/ minute
Setting Hour / Minute
Day / Month
Setting Day / Month
Year
Setting Year
Keylock
Lock all keys. Unlock method: push HOR
button, then push Trigger button, repeat 3
times.
About
Show serial number, version, and checksum
Display
Click to call up the menu panel. Click the Utility softkey on pane select in the l, Function
bottom menu, select Display in the left menu
The description of Display Menu is shown as the follows:
Menu
Settings
Description
Backlight
0% - 100%
Adjust the backlight.
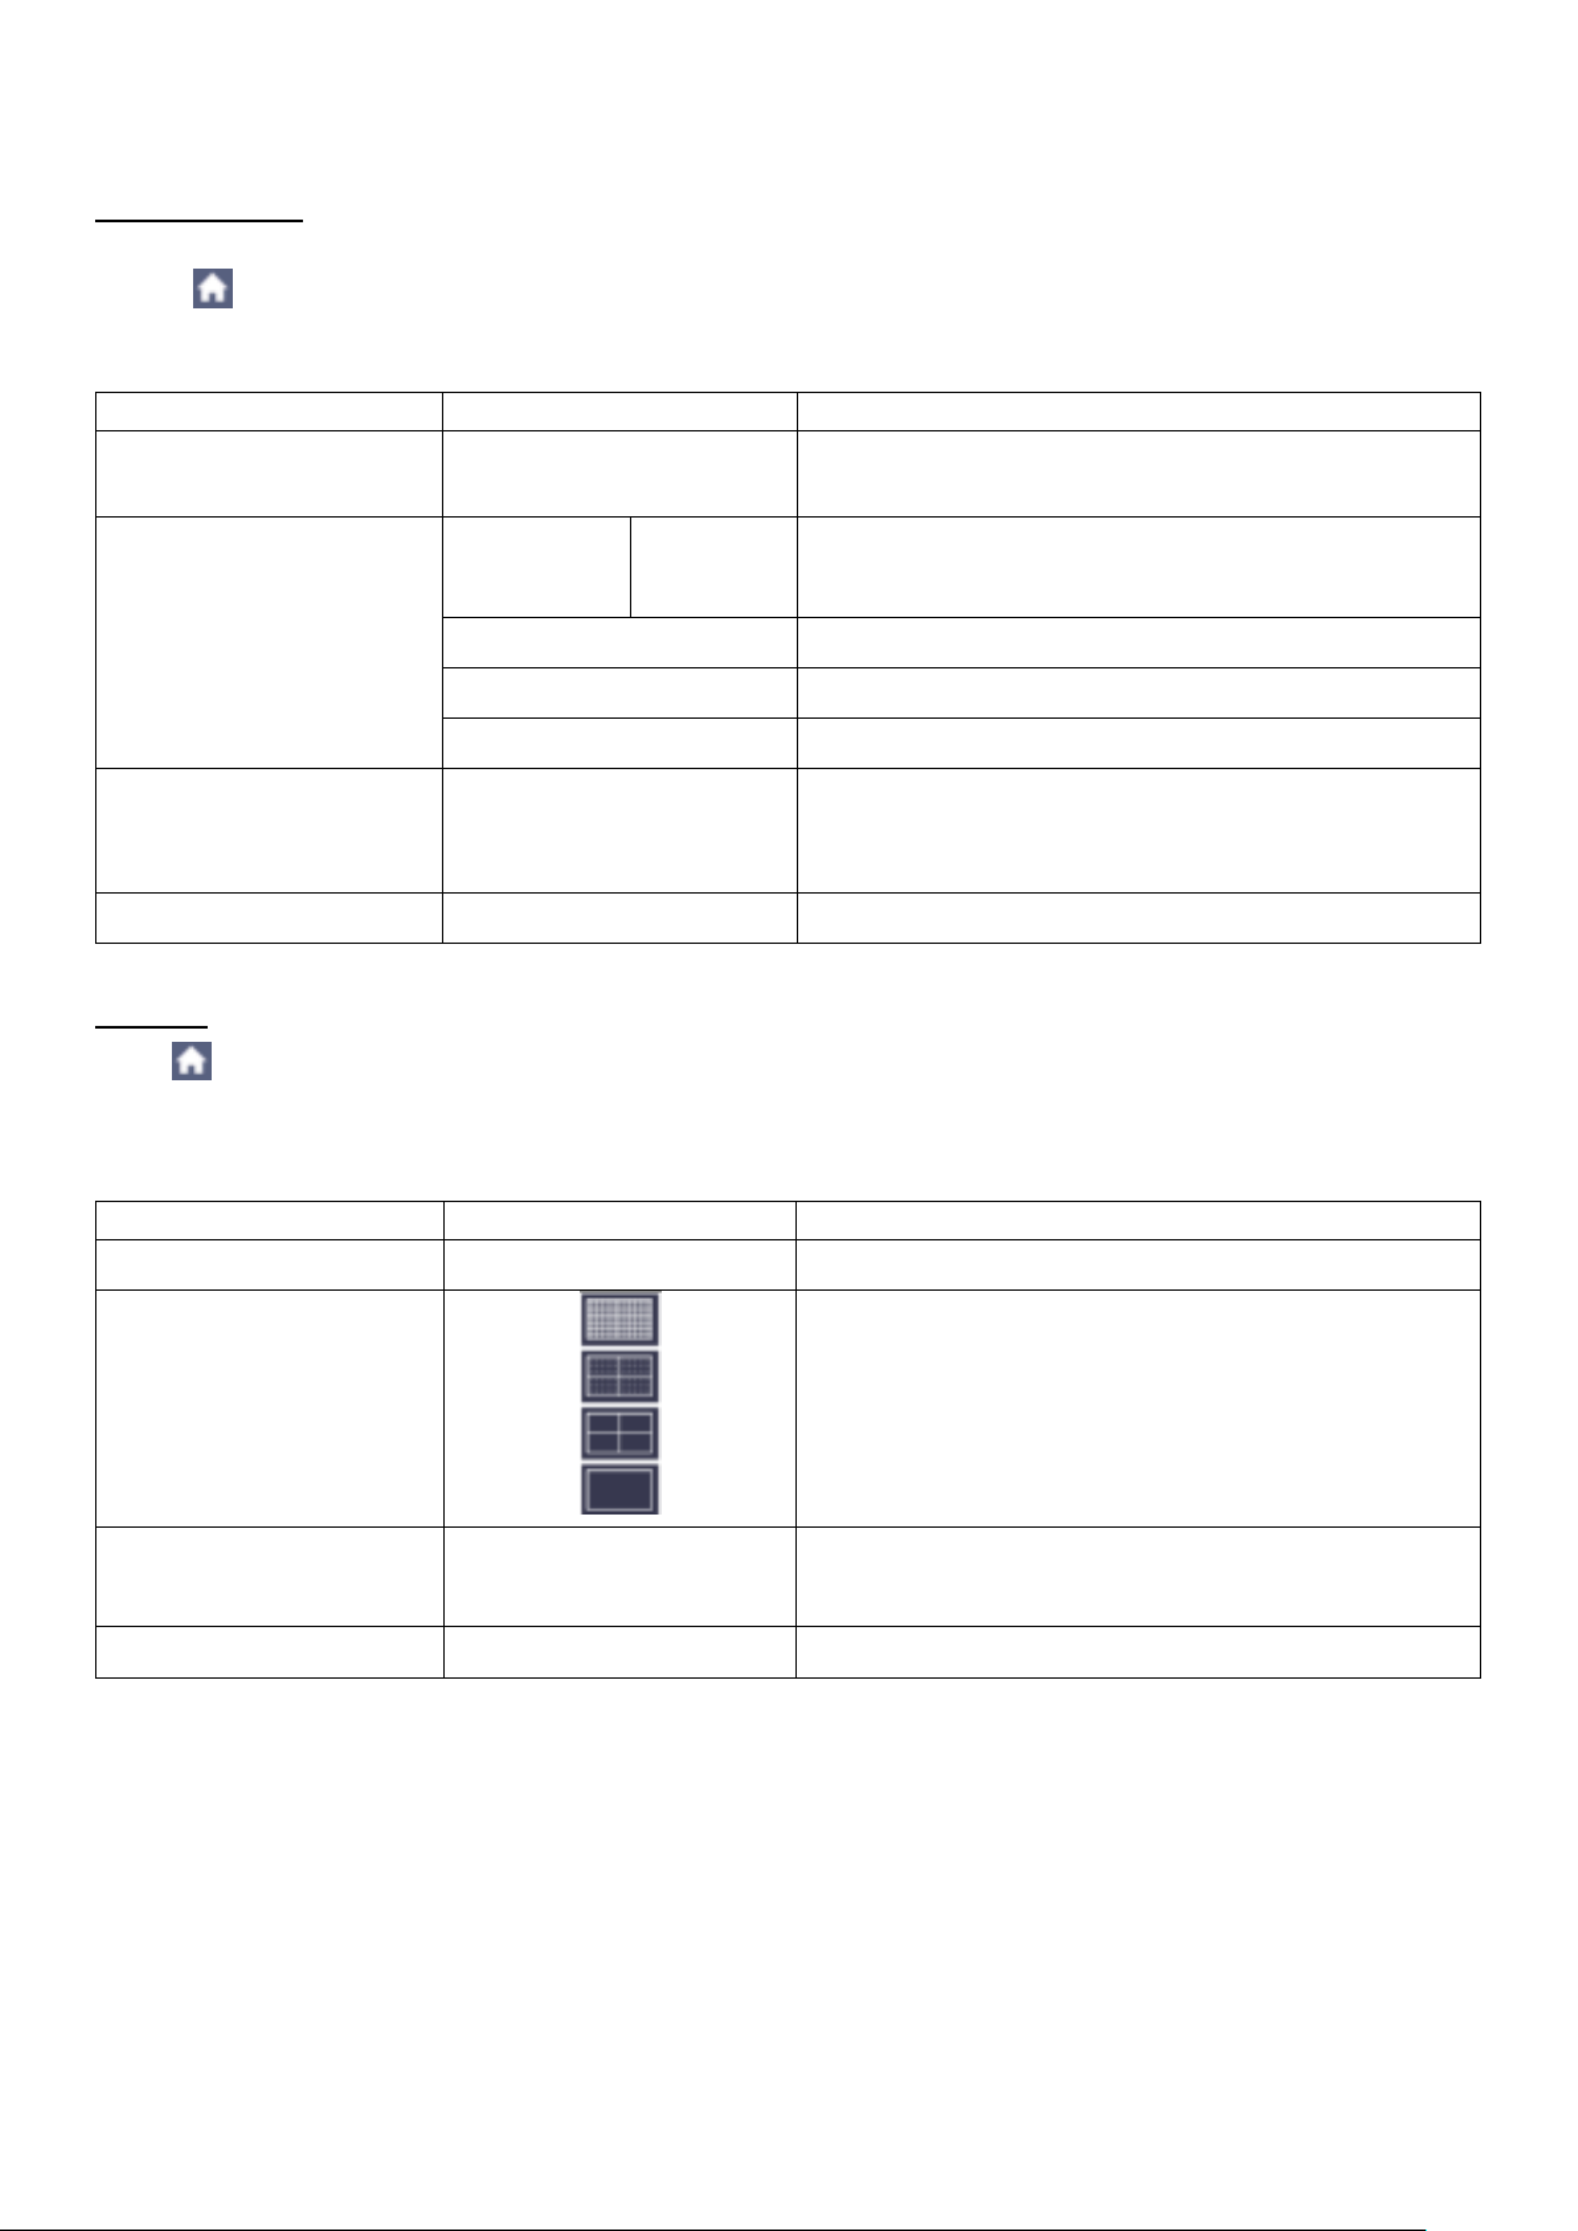
Graticule
Select the grid type
Battery
ON
OFF
Turn on or off the battery display
Menu time
OFF, 5s –30s
Set the disappear time of menu
- - 44
Adjust
Click to call up the menu panel. Click the Utility softkey on pane select in the l, Function
bottom menu, select in the left menu. Adjust
Function menu
Description
Self Cal
Carry out the self-calibration procedure.
Default
Call out the factory settings.
ProbeCh.
Check whether probe attenuation is good.
Self - Calibration
The self-calibration procedure can improve the accuracy of the oscilloscope under the ambient
temperature to the greatest extent. If the change of the ambient temperature is up to or exceeds
5°C, the self-calibration procedure should be executed to obtain the highest level of accuracy.
Before executing the self-calibration procedure, disconnect all probes or wires from the input
connector. Click to call up the menu panel. Click the Utility softkey on pane select l, Function
in the bottom menu, the function menu will display at the left, select . If everything is ready, Adjust
select in the bottom menu to enter the self-calibration procedure of the instrument. Self Cal
Probe checking
To check whether probe attenuation is good. The results contain three circumstances: Overflow
compensation, Good compensation, Inadequate compensation. According to the checking result,
users can adjust probe attenuation to the best. Operation steps are as follows:
1. Connect the probe to CH1, adjust the probe attenuation to the maximum.
2. Click to call up the menu panel. Click the Utility softkey on panel select in the ,Function
bottom menu, select in the left menu. Adjust
3. Select in the bottom menu, tips about probe checking shows on the screen. ProbeCh.
Select again to begin probe checking and the checking result will occur after 3s; ProbeCh.
push any other key to quit.
Output
Click to call up the menu panel. Click the Utility softkey on panel, select Function in the bottom
menu, select Output in the left menu.
Output menu item in the bottom menu sets the output type of Trig Out (P/F) connector on Fehler!
Verweisquelle konnte nicht gefunden werden.. In the bottom menu, select Output.
The description of is shown as the follows: Output menu
Menu
Settings
Description
Output
Trig Out
Output trig signal synchronously
Pass/Fail
Output High Level when Pass, and Low Level
when Fail
Device and Print Set menu items set the print output, refer to "Fehler! Verweisquelle konnte
nicht gefunden werden."

- - 45
LAN Set
To use the LAN network connection with the computer, please read the corresponding article
"Connection with the PC".
Update
Use the side panel USB port to update your instrument firmware using a USB memory device.
Refer to " " Fehler! Verweisquelle konnte nicht gefunden werden.
8.1 Set the Display system
Click to call up the menu panel. Click the Display softkey on panel, the Display menu is shown
as follows:
Display
Press the Display menu selection button. In the lower selection menu, select Type and now you
can switch between Dot and Vect by pressing a button.
8.1.1 Persist
When the function is used, the persistence display effect of the picture tube oscilloscope Persist
can be simulated. The reserved original data is displayed in fade color and the new data is in bright
color.
(1) Click to call up the menu panel. Click the Display softkey on panel.
(2) Select in the bottom menu. Persist&Color
(3) Select in the right menu. Persist
(4) In the Time menu, select the persist time, including OFF, 1 Second, 2 Seconds, 5 Seconds
and Infinity Infinity . When the " " option is set for Persist Time, the measuring points will be
stored till the controlling value is changed Select to turn off persistence and clear the . OFF
display.
(5) Select in the bottom menu to erase the results of previous acquisitions from the display. Clear
The oscilloscope will start to accumulate acquisitions again.
Menu
Settings
Description
Type
Dots
Vect
Only the sampling points are displayed.
The space between the adjacent sampling points in
the display is filled with the vector form.
Persist
& Color
Time
OFF
1 sec.
2 sec.
5 sec.
Infinit
y
Set the persistence time
Color
ON
OFF
Turn on/off the color temperature function
Counter
ON
OFF
Turn on/off counter
Clear
Erase the results of previous acquisitions from the
display. The oscilloscope will start to accumulate
acquisitions again.
- - 46
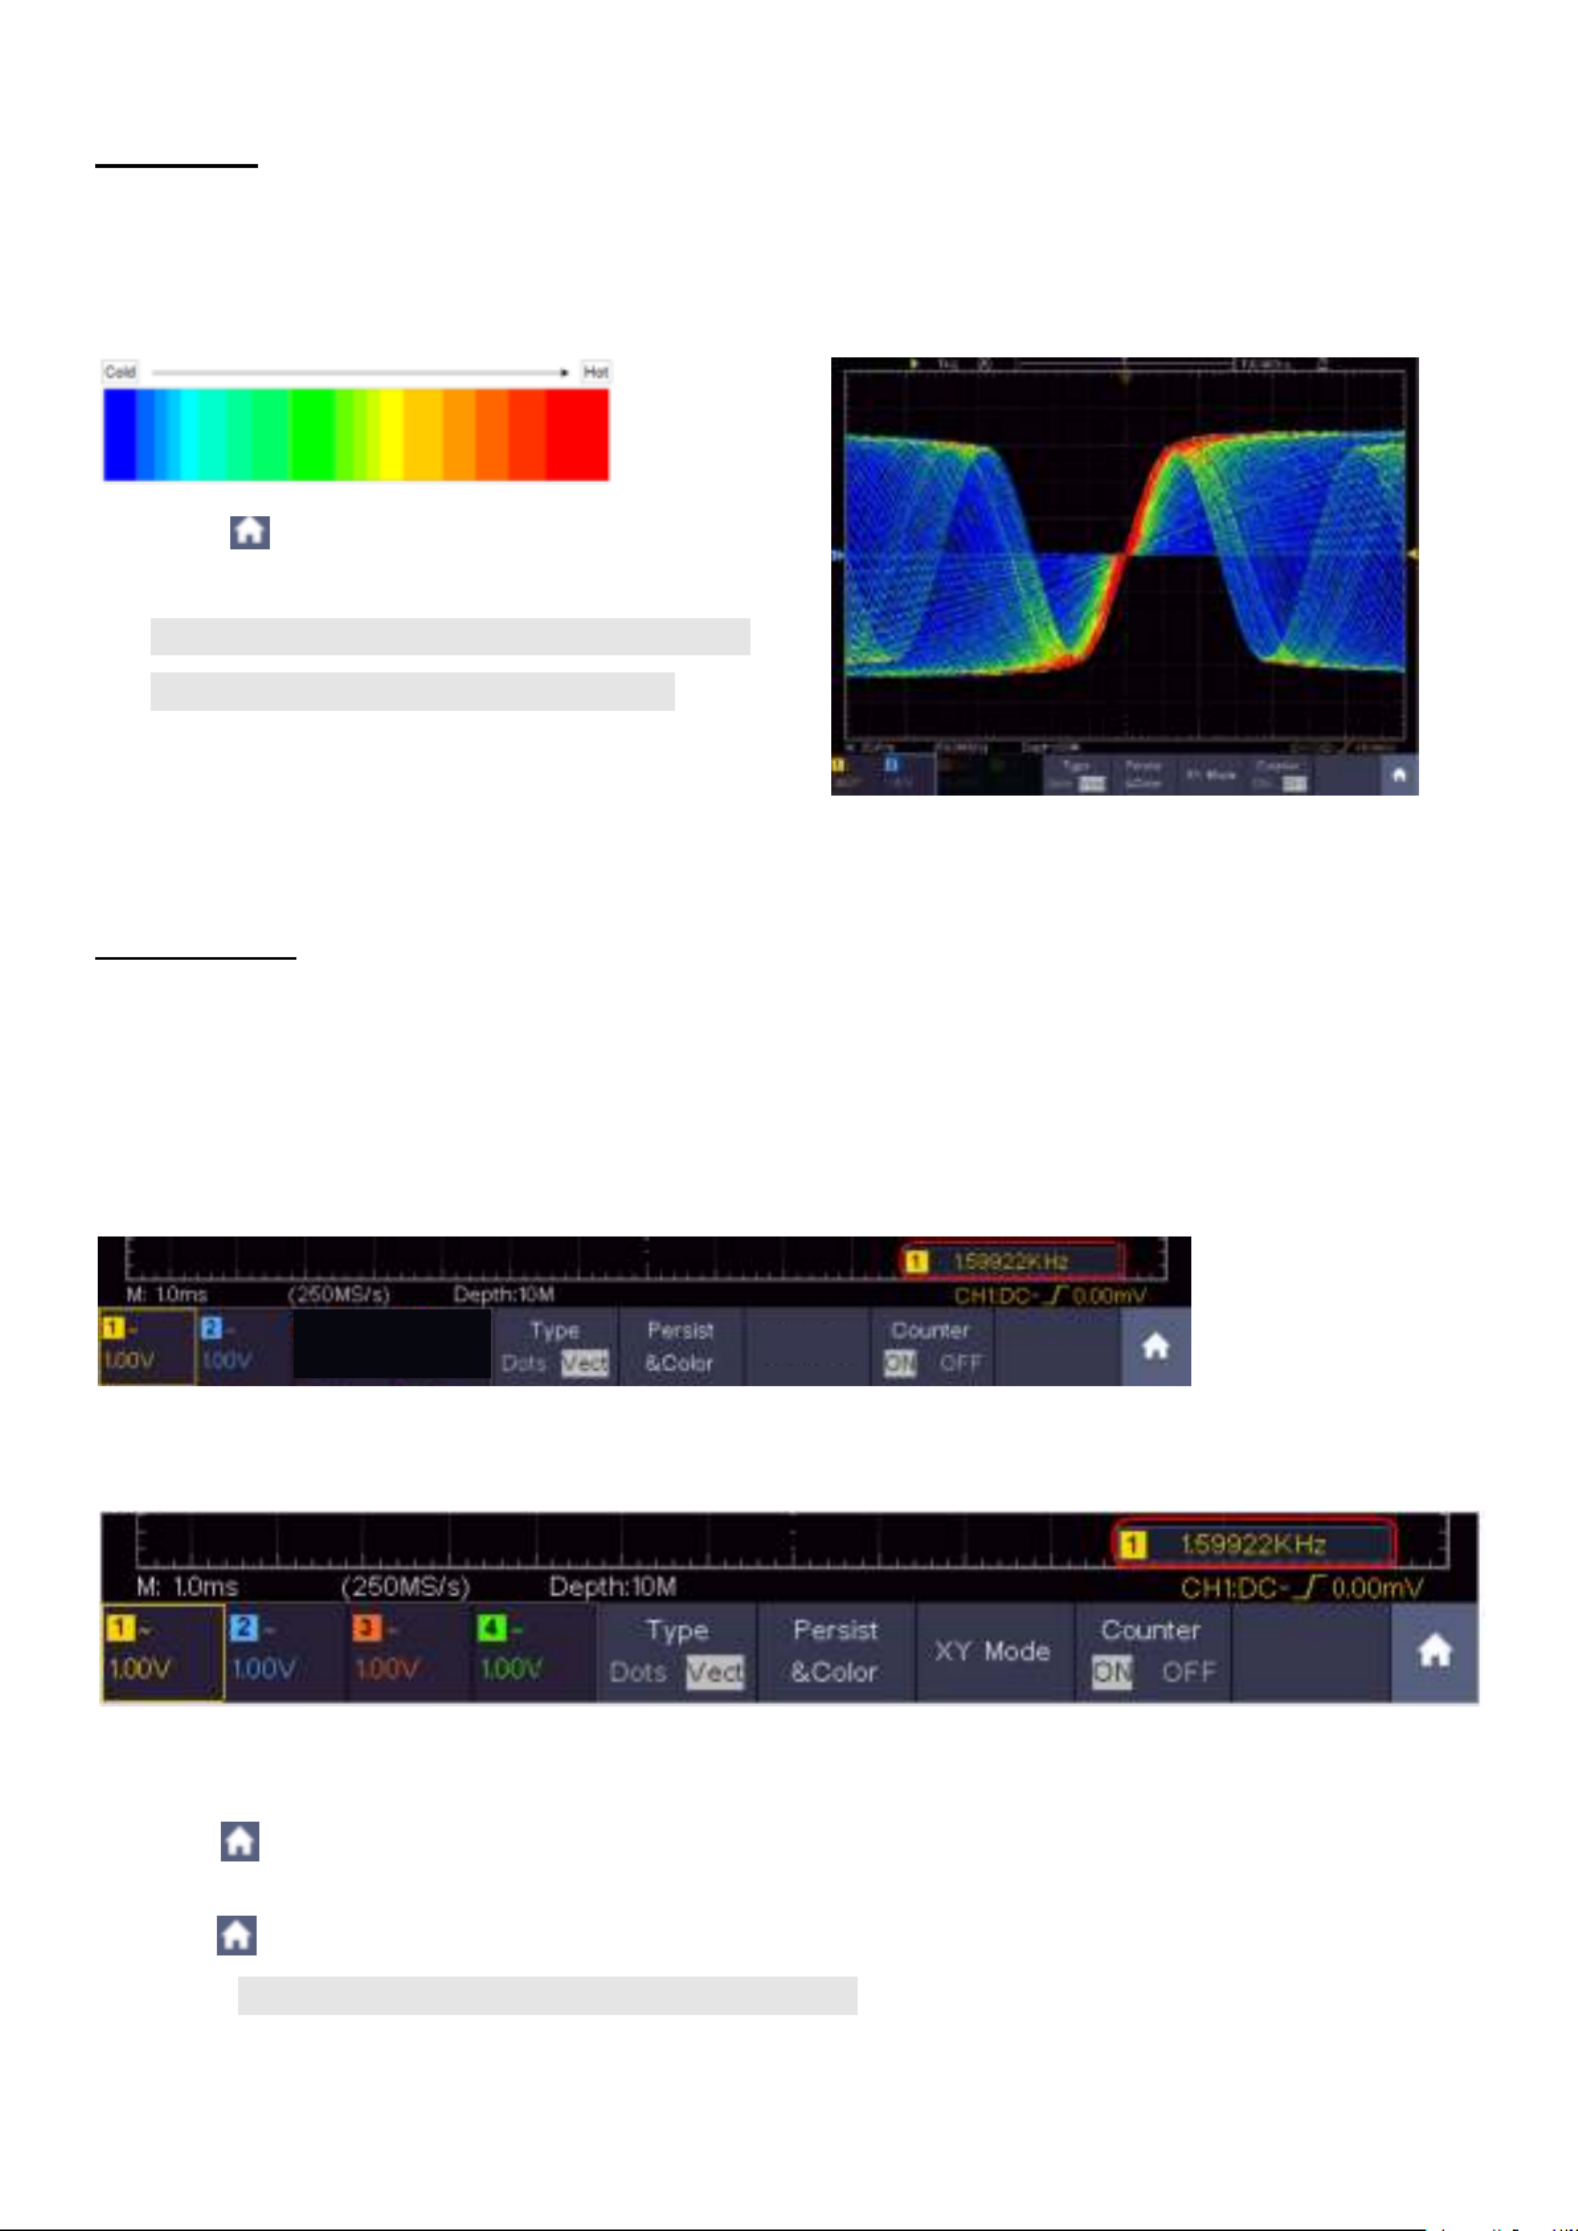
8.1.2 Color
Color temperature function uses color-grading to indicate frequency of occurrence. The hot colors
like red/yellow indicate frequently occurring events, and the colder colors like blue/green indicate
rarely occurring events.
(1) Click to call up the menu panel. Click the
Display softkey on panel.
(2) Select in the bottom menu.Persist&Color
(3) Select in the right menu, choose Color
between / .ON OFF
Figure 4.3 Temperature color function is turned on
8.1.3 Counter
It is a 6-digit single-channel counter. The counter can only measure the frequency of the triggering
channel. The frequency range is from 2Hz to the full bandwidth. Only if the measured channel is in
Edge Single mode of trigger type, the counter can be enabled. The counter is displayed at the
right bottom of the screen.
2 CH:
Figure 4.4 Frequenca counter display 2CH
4CH:
Figure 5 Frequency counter display 4CH 4.
Operation steps:
1. Click , click the softkey on pane set the trigger type to Trig Menu l, Single, set the trigger
mode to , select the signal source. Edge
2. Click , click the softkey on panel Display .
3. Select Counter OFF as ON or in the bottom menu.

- - 47
8.2 Save and recall a waveform
Click to call up the menu panel. Click the softkey on pane you can save the waveforms, Save l,
configures, screen images, record or clone the waveform.
Function Menu
Settings
Description
Type
Wave
Configure
Image
Record
Clone
Choose the saving type.
About the type, see "Record Fehler!
Verweisquelle konnte nicht gefunden werden."
on P Fehler! Textmarke nicht definiert..
About the Clone type, see “Fehler! Verweisquelle
konnte nicht gefunden werden.” on PFehler!
Textmarke nicht definiert..
When the type is , the menu shows as following: Wave
Type
Wave
Format
(Right menu)
For internal storage, only BIN can be selected. For
external storage, the format can be BIN, TXT or
CSV.
Source
CH1
CH2
CH3
CH4
Math
(or MathFFT)
Check the waveform to be saved. (If certain
channel is off, the corresponding menu item will be
disabled.)
Object
& Show
Object
Wave0 to
Wave99
Choose the address which the waveform is saved
to or recall from.
Show
ON
OFF
Recall or close the waveform stored in the current
object address. When the show is ON, if the current
object address has been used, the stored
waveform will be shown, the address number and
relevant information will be displayed at the top left
of the screen; if the address is empty, it will prompt
"None is saved".
Close All
Close all the waveforms stored in the object
address.

- - 48
Save
Save the waveform of the source to the selected
address. Whatever the of save menu is set, Type
you can save the waveform by just pressing the
Copy panel button in any user interface.
Select in the bottom menu, in the right Type
Format menu, you can select the storage format.
Storage
Internal
External
Save to internal storage or USB storage. When
External is selected, save the waveform according
to the current record length (see "Fehler!
Verweisquelle konnte nicht gefunden werden."
on P ); the file Fehler! Textmarke nicht definiert.
name is editable. The BIN waveform file could be
open by OWON waveform analysis software (on
the supplied CD).
When the type is , the menu shows as following: Configure
Configure
Setting0
…..
Setting19
The setting address
Save
Save the current oscilloscope configure to the
internal storage
Load
Recall the configure from the selected address
When the type is , the menu shows as following: Image
Save
Save the current display screen. The file can be
only stored in a USB storage, so a USB storage
must be connected first. The file name is editable.
The file is stored in BMP format.
8.2.1 Save and recall the waveform
The oscilloscope can store 100 waveforms, which can be displayed with the current waveform at
the same time. The stored waveform called out cannot be adjusted.
In order to save the waveform of CH1, CH2 and Math into the address 1, the operation steps should
be followed:
1. Turn on CH1, CH2 and Math channels.
2. Click to call up the menu panel. Click the Save softkey on panel.
3. : Select in the bottom menu, select in the left menu. Saving Type Wave
4. Select in the bottom menu, select in the right menu. Storage Internal
5. Select in the bottom menu, check Source CH1 Math, CH2, in the right menu for Source.

- - 49
6. Select in the bottom menu, select as object address in the left menu. Object & Show Wave1
7. Select in the bottom menu to save the waveform. Save
8. : Select Recalling Object & Show Wave1 in the bottom menu, select in the left menu. In the
right menu, select Show as ON, the waveform stored in the address will be shown, the address
number and relevant information will be displayed at the top left of the screen.
Tip:
Regardless of which type has been selected in the Save menu, you can always save the current
waveform directly as a BIN file using the Copy button, without going through the save menu. If the
storage has been set to external, make sure that there is also an external storage medium on the
oscilloscope. Please set up the USB storage device as shown in the following chapters.
8.2.2 Save the current screen image
A screenshot can only be saved on an external USB storage device.
1. Install a USB storage device: Insert a USB stick into the "USB host port" of the device. If a USB
symbol is displayed in the upper right, the USB storage device has been correctly recognized
and connected. If the USB storage device is not recognized correctly, please proceed as
described in the corresponding chapter.
2. After the USB storage device is installed, click to call up the menu panel. Click the Save
softkey on panel, the save menu is displayed at the bottom of the screen.
3. Select in the bottom menu, select in the left menu. Type Image
4. Select in the bottom menu, an input keyboard used to edit the file name will pop up. The Save
default name is current system date and time. Select the key in the keyboard to confirm.
8.2.3 Requirements of the USB storage device
The supported file format of a USB storage device is: FAT32 file system with a cluster size of not
more than 4KB. A USB mass storage device is also supported. If a connected USB storage device
does not work, format it as described in the following two options: Using the system tool or a
formatting tool (8Gbyte or larger USB memory sticks can be formatted using the second method).
8.2.4 Use system provided function to format the USB device
1. Connect the USB storage device to the computer
2. Right click - to enter Computer Management interface Computer Manage
3. Click Disk Management menu, and information about the USB disk will display on the right side
with red mark 1 and 2.
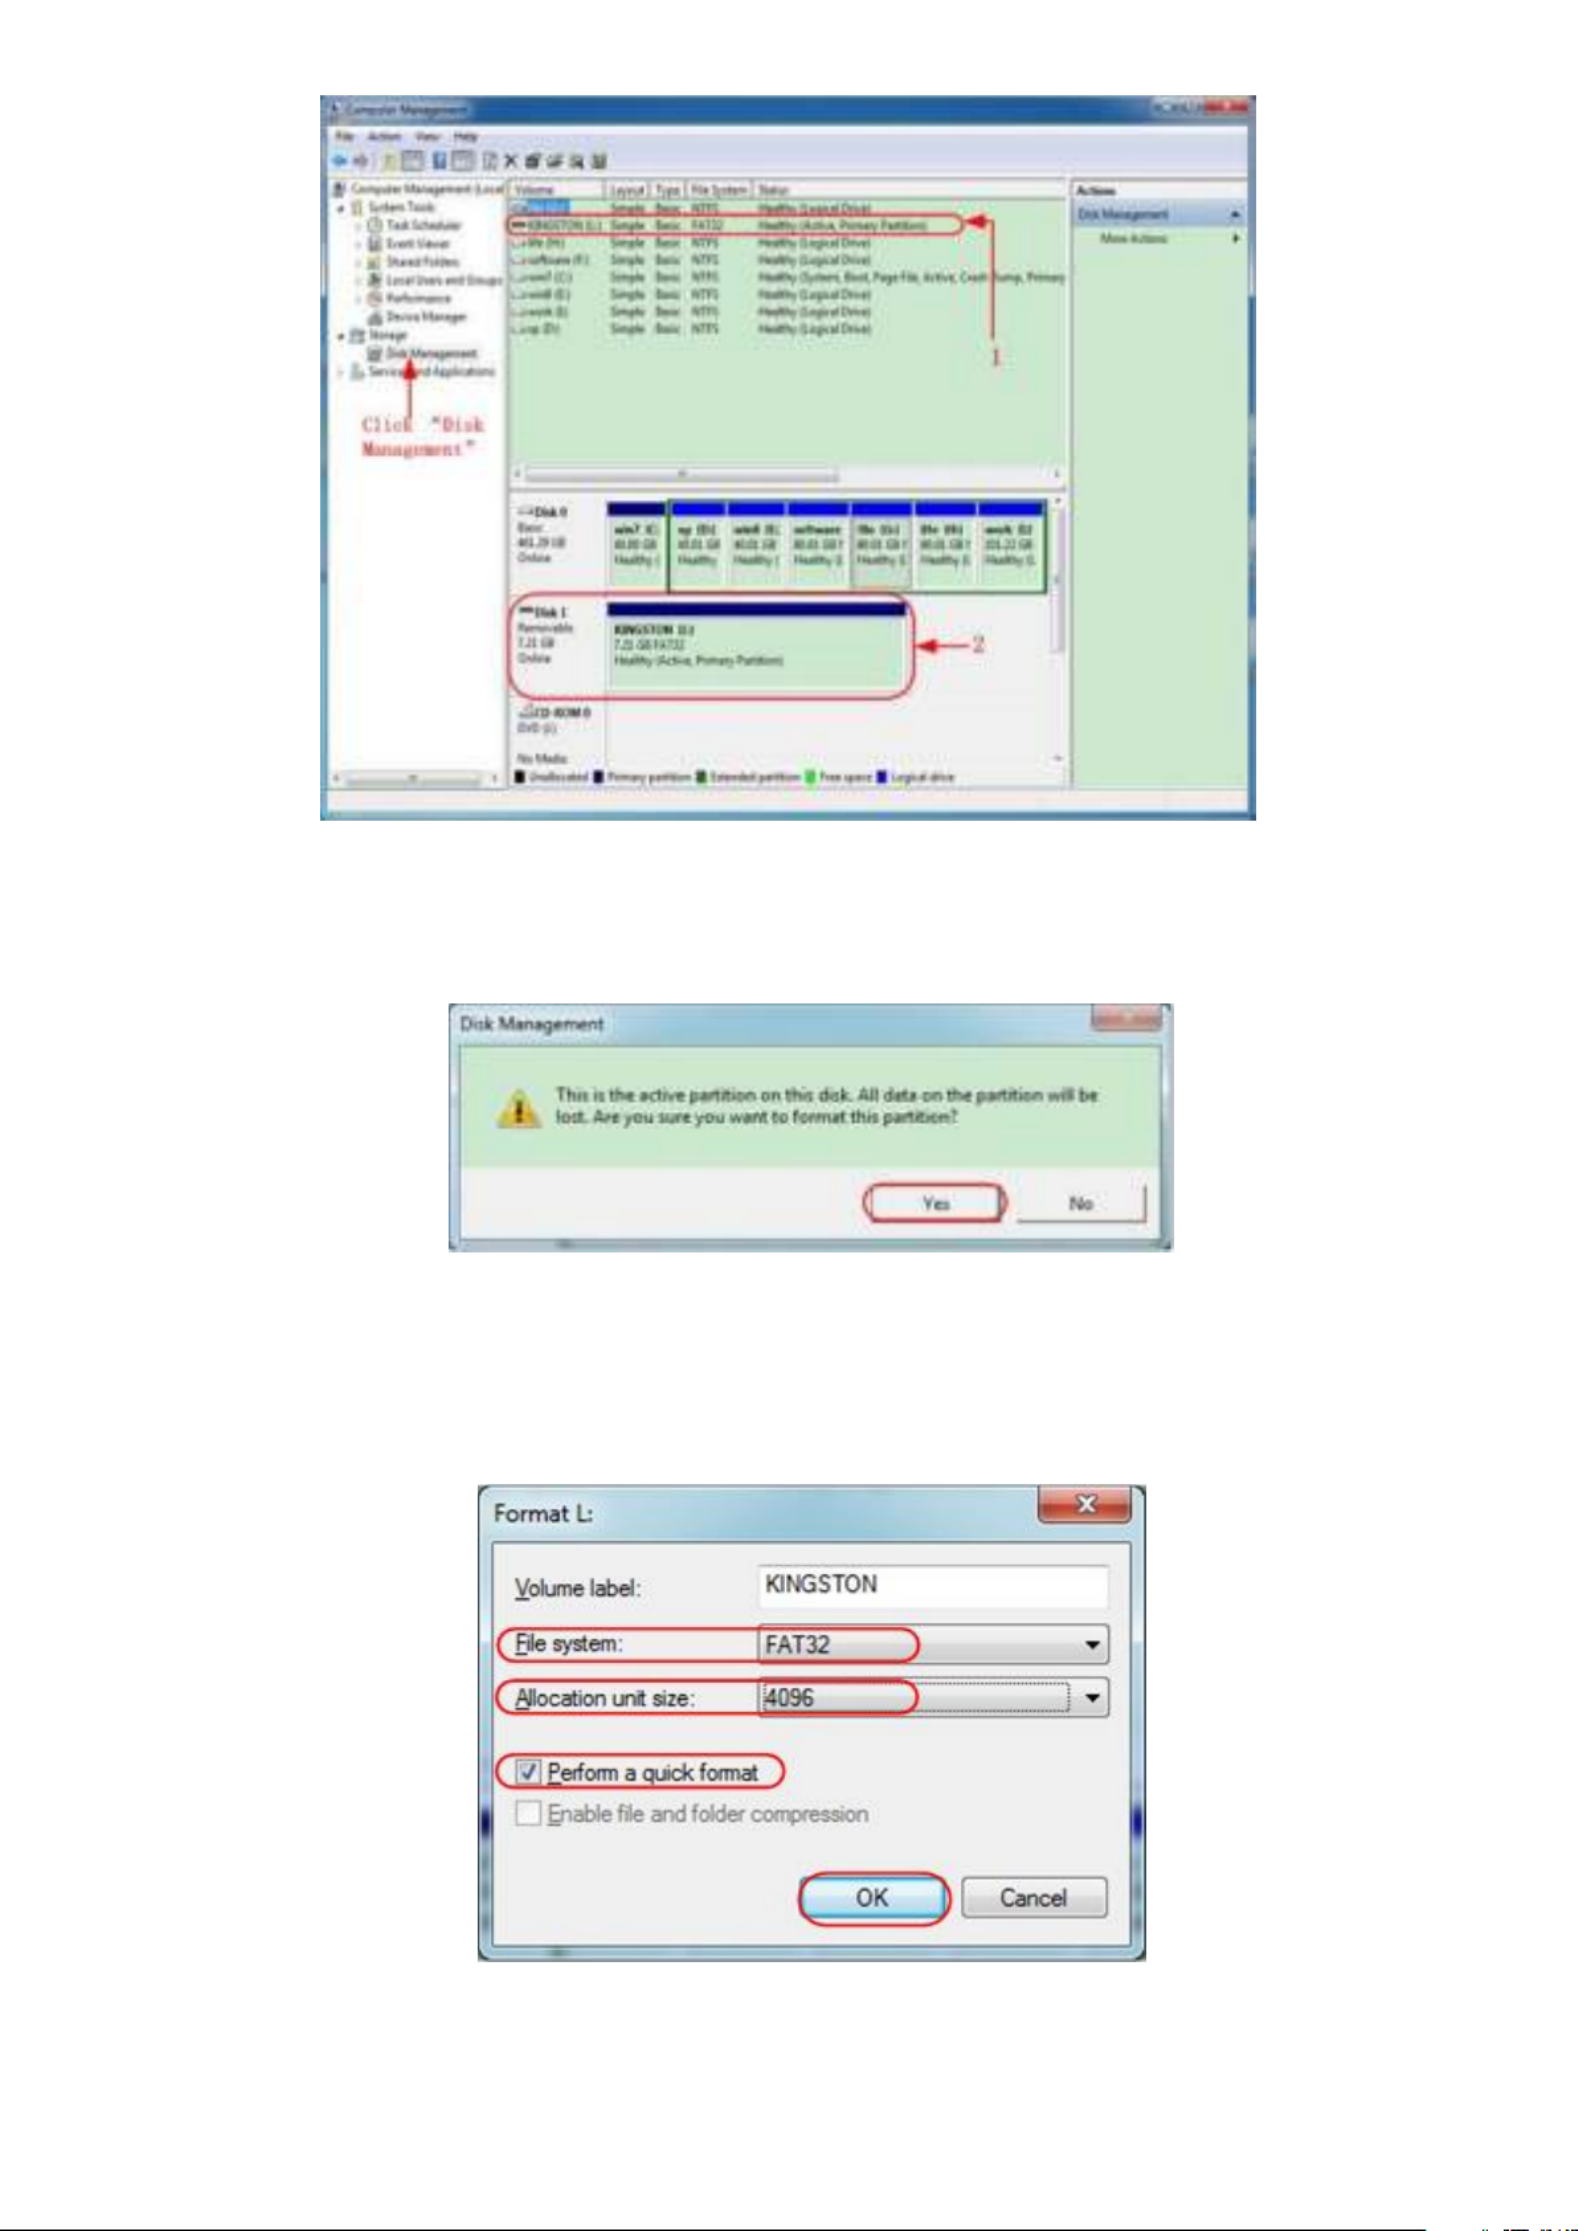
- - 50
Figure 4.6 Disc manager
1. Right click on the area marked in red and select Format and a warning message appears,
which you confirm with YES.
Figure 4.7 Warning message USB
2. Set the file format as FAT32 with a cluster size of 4096. Select quick formatting "Perform a
quick format" and confirm with OK and confirm with YES.
Figure 4.8 Setting for formatting the USB device
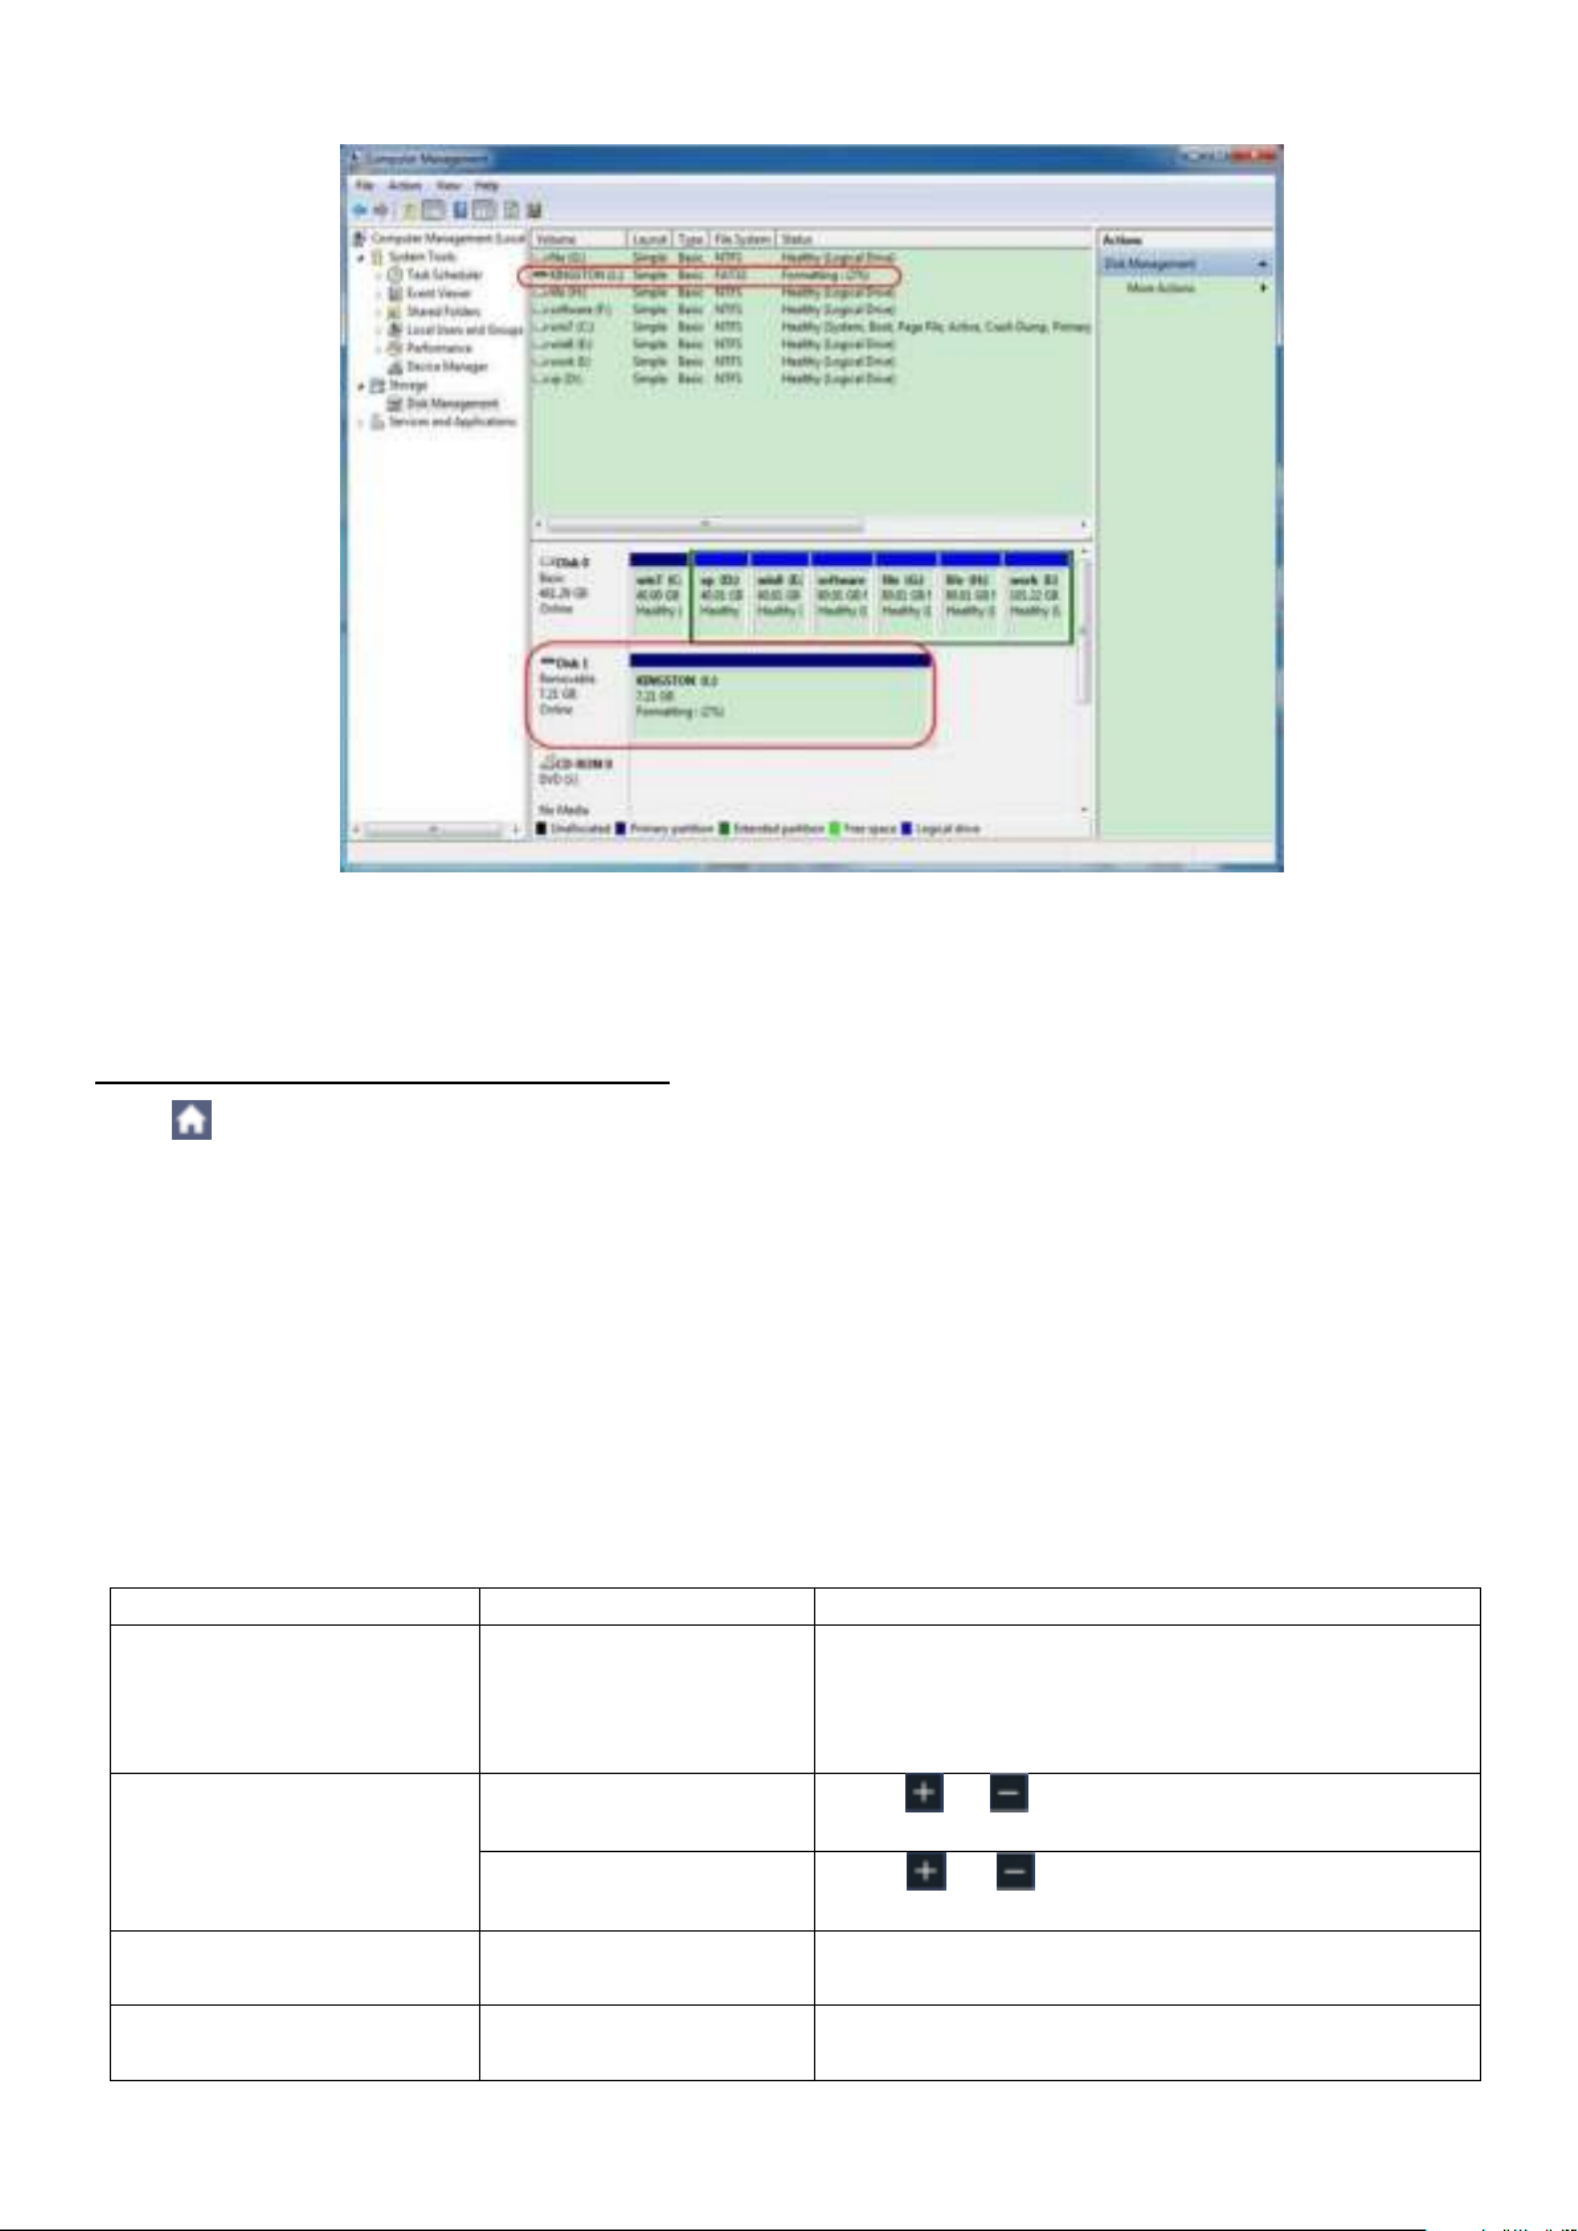
- - 51
3. Formatting process
Figure 4.9 Formatting the USB device
4. Check whether the formatting has been carried out and FAT32 with a cluster size of 4096 is
now displayed.
8.2.5 Record and playback waveforms
Click to call up the menu panel. Click the Save Type softkey on panel. Select in the bottom
menu, select in the left menu. Record
Wave Record function can record the input current wave. You can set the interval between
recorded frames in the range of 10 ms - 10 s. The max frame number reaches 1000, and you can
get better analysis effect with playback and storage function. The storage medium contains two
kinds: Internal and External.
When the storage medium is Internal, Wave Record contains four modes: OFF, Record,
Playback Storage and .
When storage medium is External, Wave Record contains two modes: OFF, Record.
Record: To record wave according to the interval until it reaches the end frame set.
Record menu (Internal Storage) shows as follows:
Menu
Settings
Description
Mode
OFF
Record
Playback
Storage
Close wave record function
Set record menu
Set playback menu
Set storage menu
Record Mode
Frame Set
End Frame
Click or to select the number of frames
to record (1 - 1000)
Interval
Click or to select the interval between
recorded frames (10ms - 10s)
Refresh
ON
OFF
Refresh wave during recording
Stop refreshing
Operate
Play
Stop
Begin to record
Stop recording
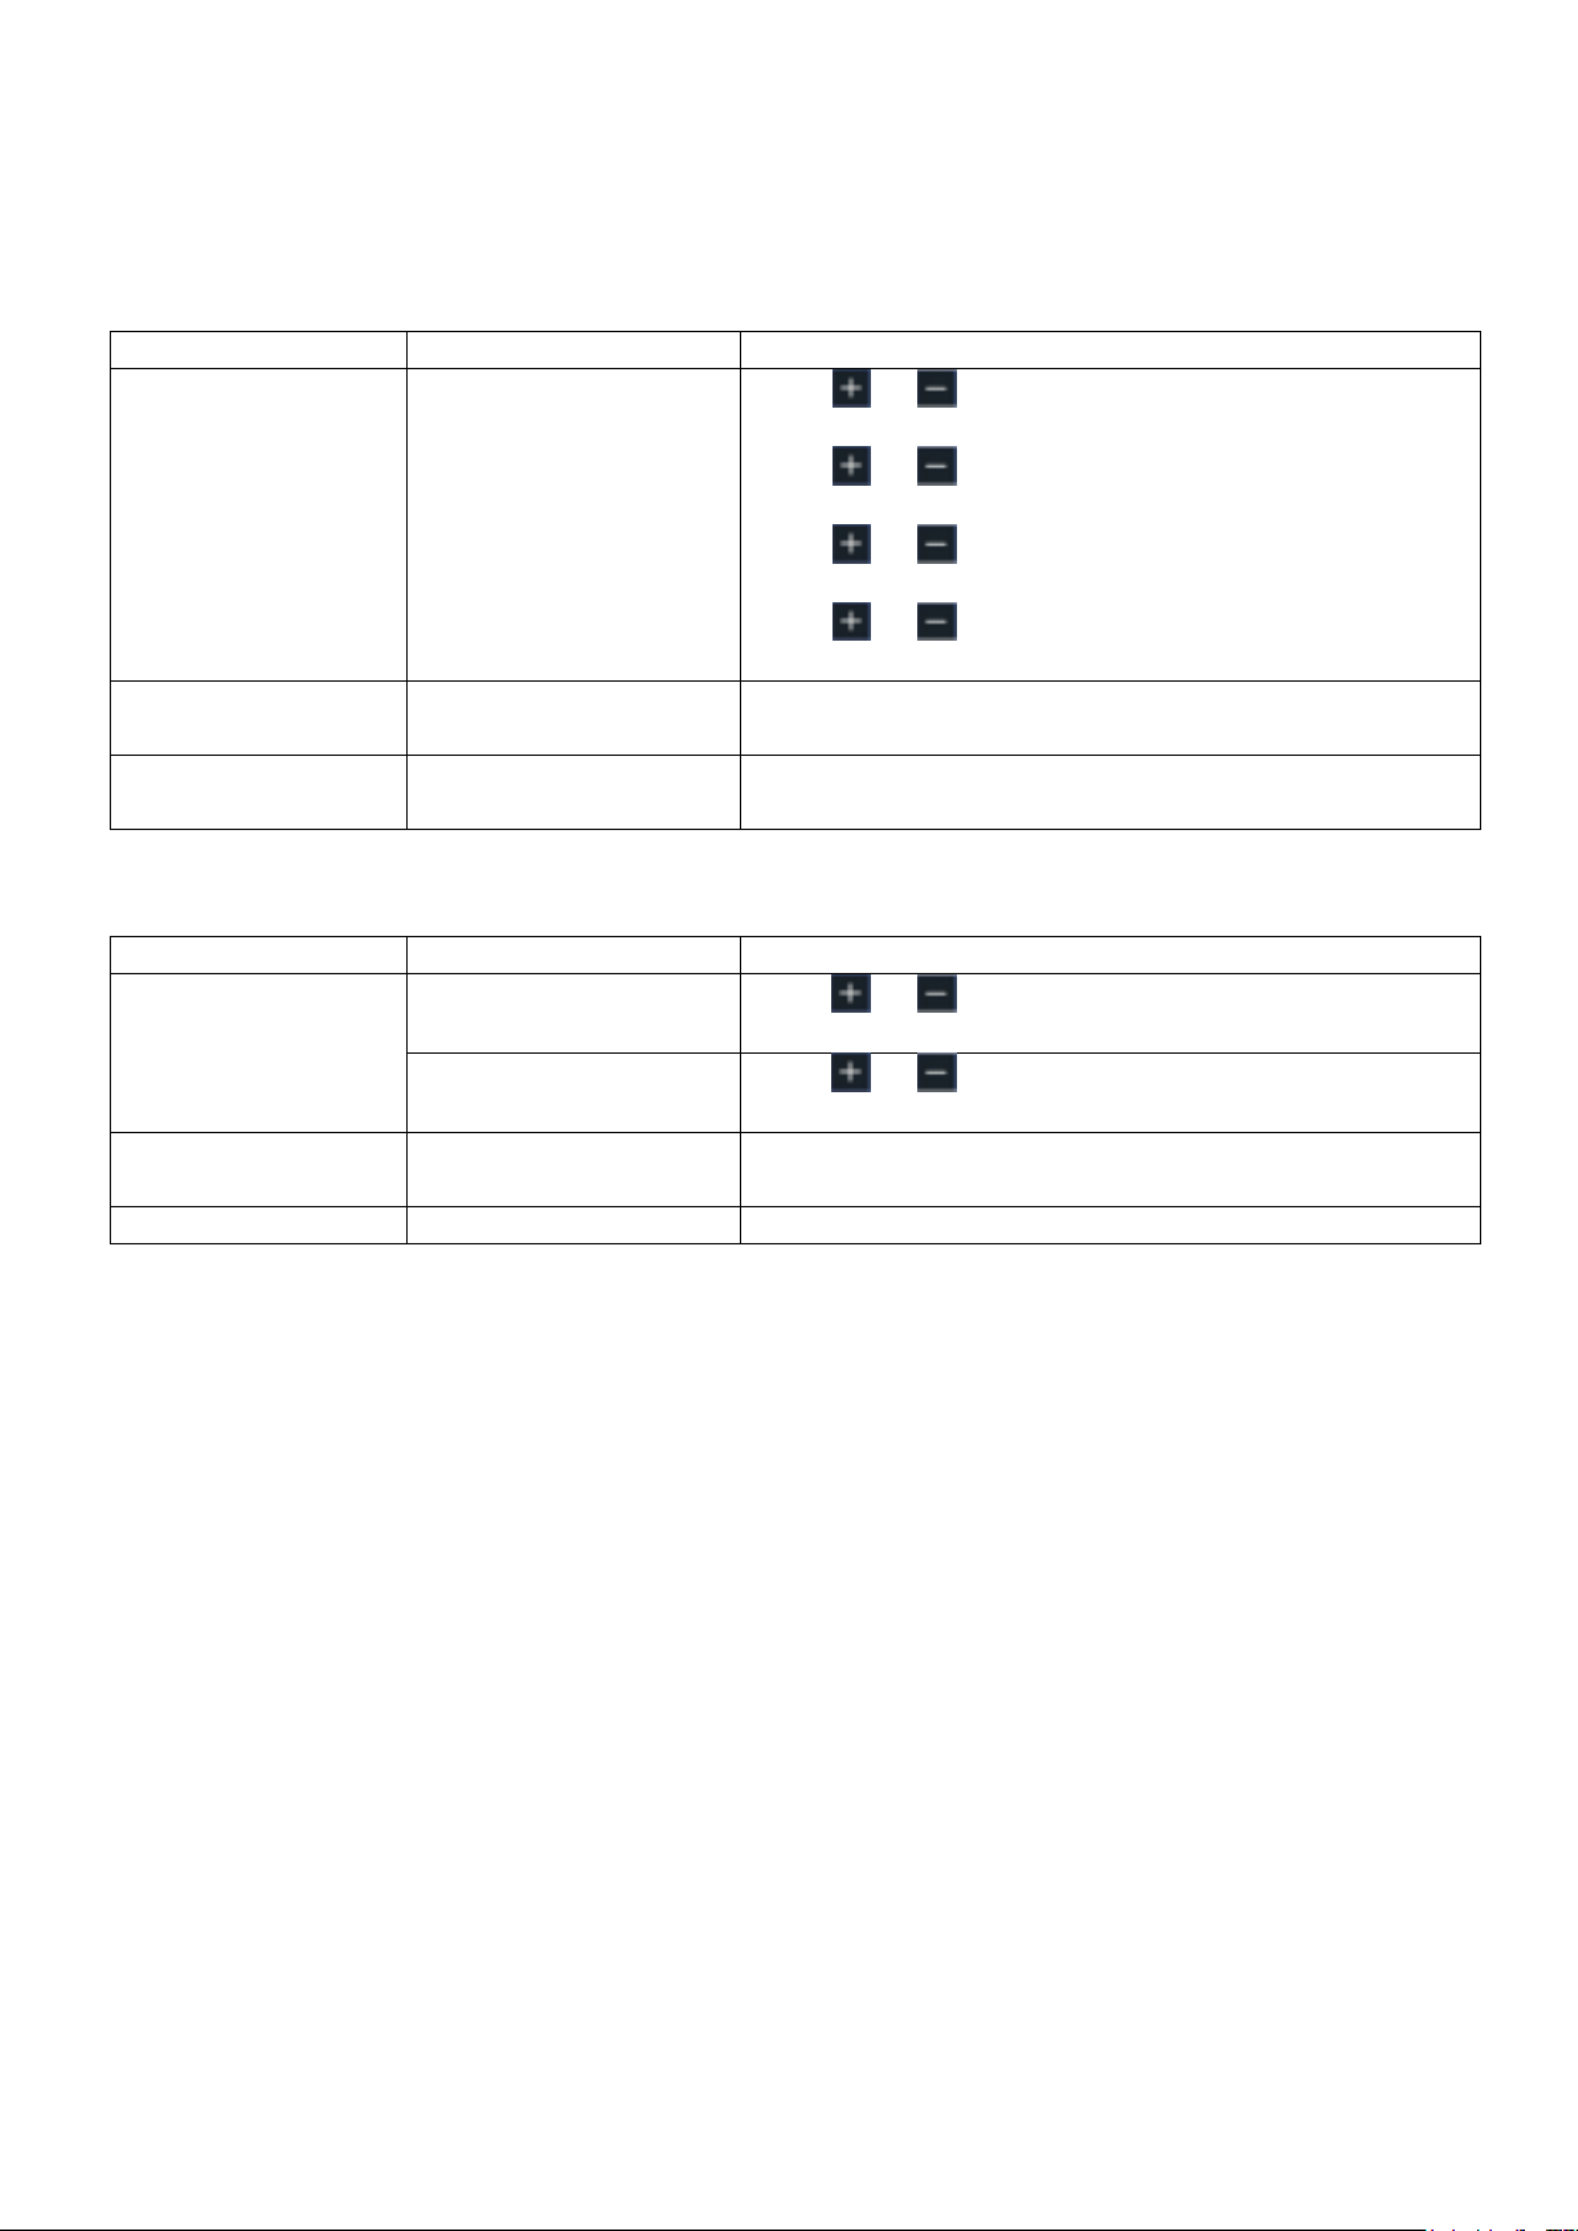
- - 52
Note:
Both of the waveforms of Channel 1 and Channel 2 will be recorded. If a Channel is turned off
while recording, the waveform of the channel is invalid in the playback mode.
Playback: Play back the wave recorded or saved.
Playback menu shows as follows:
Menu
Settings
Description
Playback Mode
Frame Set
Start Frame
End Frame
Cur Frame
Interval
Click or to select the number of start frame
to playback (1 - 1000)
Click or to select the number of end frame
to playback (1 - 1000)
Click or to select the number of current
frame to playback (1 - 1000)
Click or to select the interval between
played back frames (10ms - 10s)
Play Mode
Loop
Once
Play back the wave continuously
Play back the wave just one time
Operate
Play
Stop
Begin to record
Stop recording
Storage: Save the current wave according to the start frame and end frame set.
Storage menu shows as follows:
Menu
Settings
Description
Storage
Mode
Frame Set
Start Frame
Click or to select the number of start frame
to store (1 - 1000)
End Frame
Click or to select the number of end frame
to store (1 - 1000)
Save
Save the waveform record file to the internal
memory
Load
Load the waveform record file from the memory
Use the waveform record as follows:
1. After opening the menu, press the Save button
2. Select Type in the lower image menu, select Record
3. Select in the bottom menu, select in the right menu Mode OFF
4. In the bottom menu, select as Storage Internal
5. Select in the bottom menu, select in the right menu Mode Record
6. Select in the bottom menu, set and in the right menu FrameSet End frame Interval
7. In the bottom menu, set Refresh
8. In the bottom menu, select as Operate Play
9. Select in the bottom menu, select Mode Playback FrameSet in the right menu. Set and
Playmode Operate Play, select as
10. To save the wave recorded, select in the bottom menu, selec in the right menu. Mode t Storage
Select in the bottom menu to set the range of frames to store, select in the FrameSet Save
bottom menu
11. To load the waveform from the internal memory, select in the bottom menu, then enter the Load
Playback Mode of the to analyze the wave
Note: When playback the waveform, the sampling, trigger, or display function is not available.
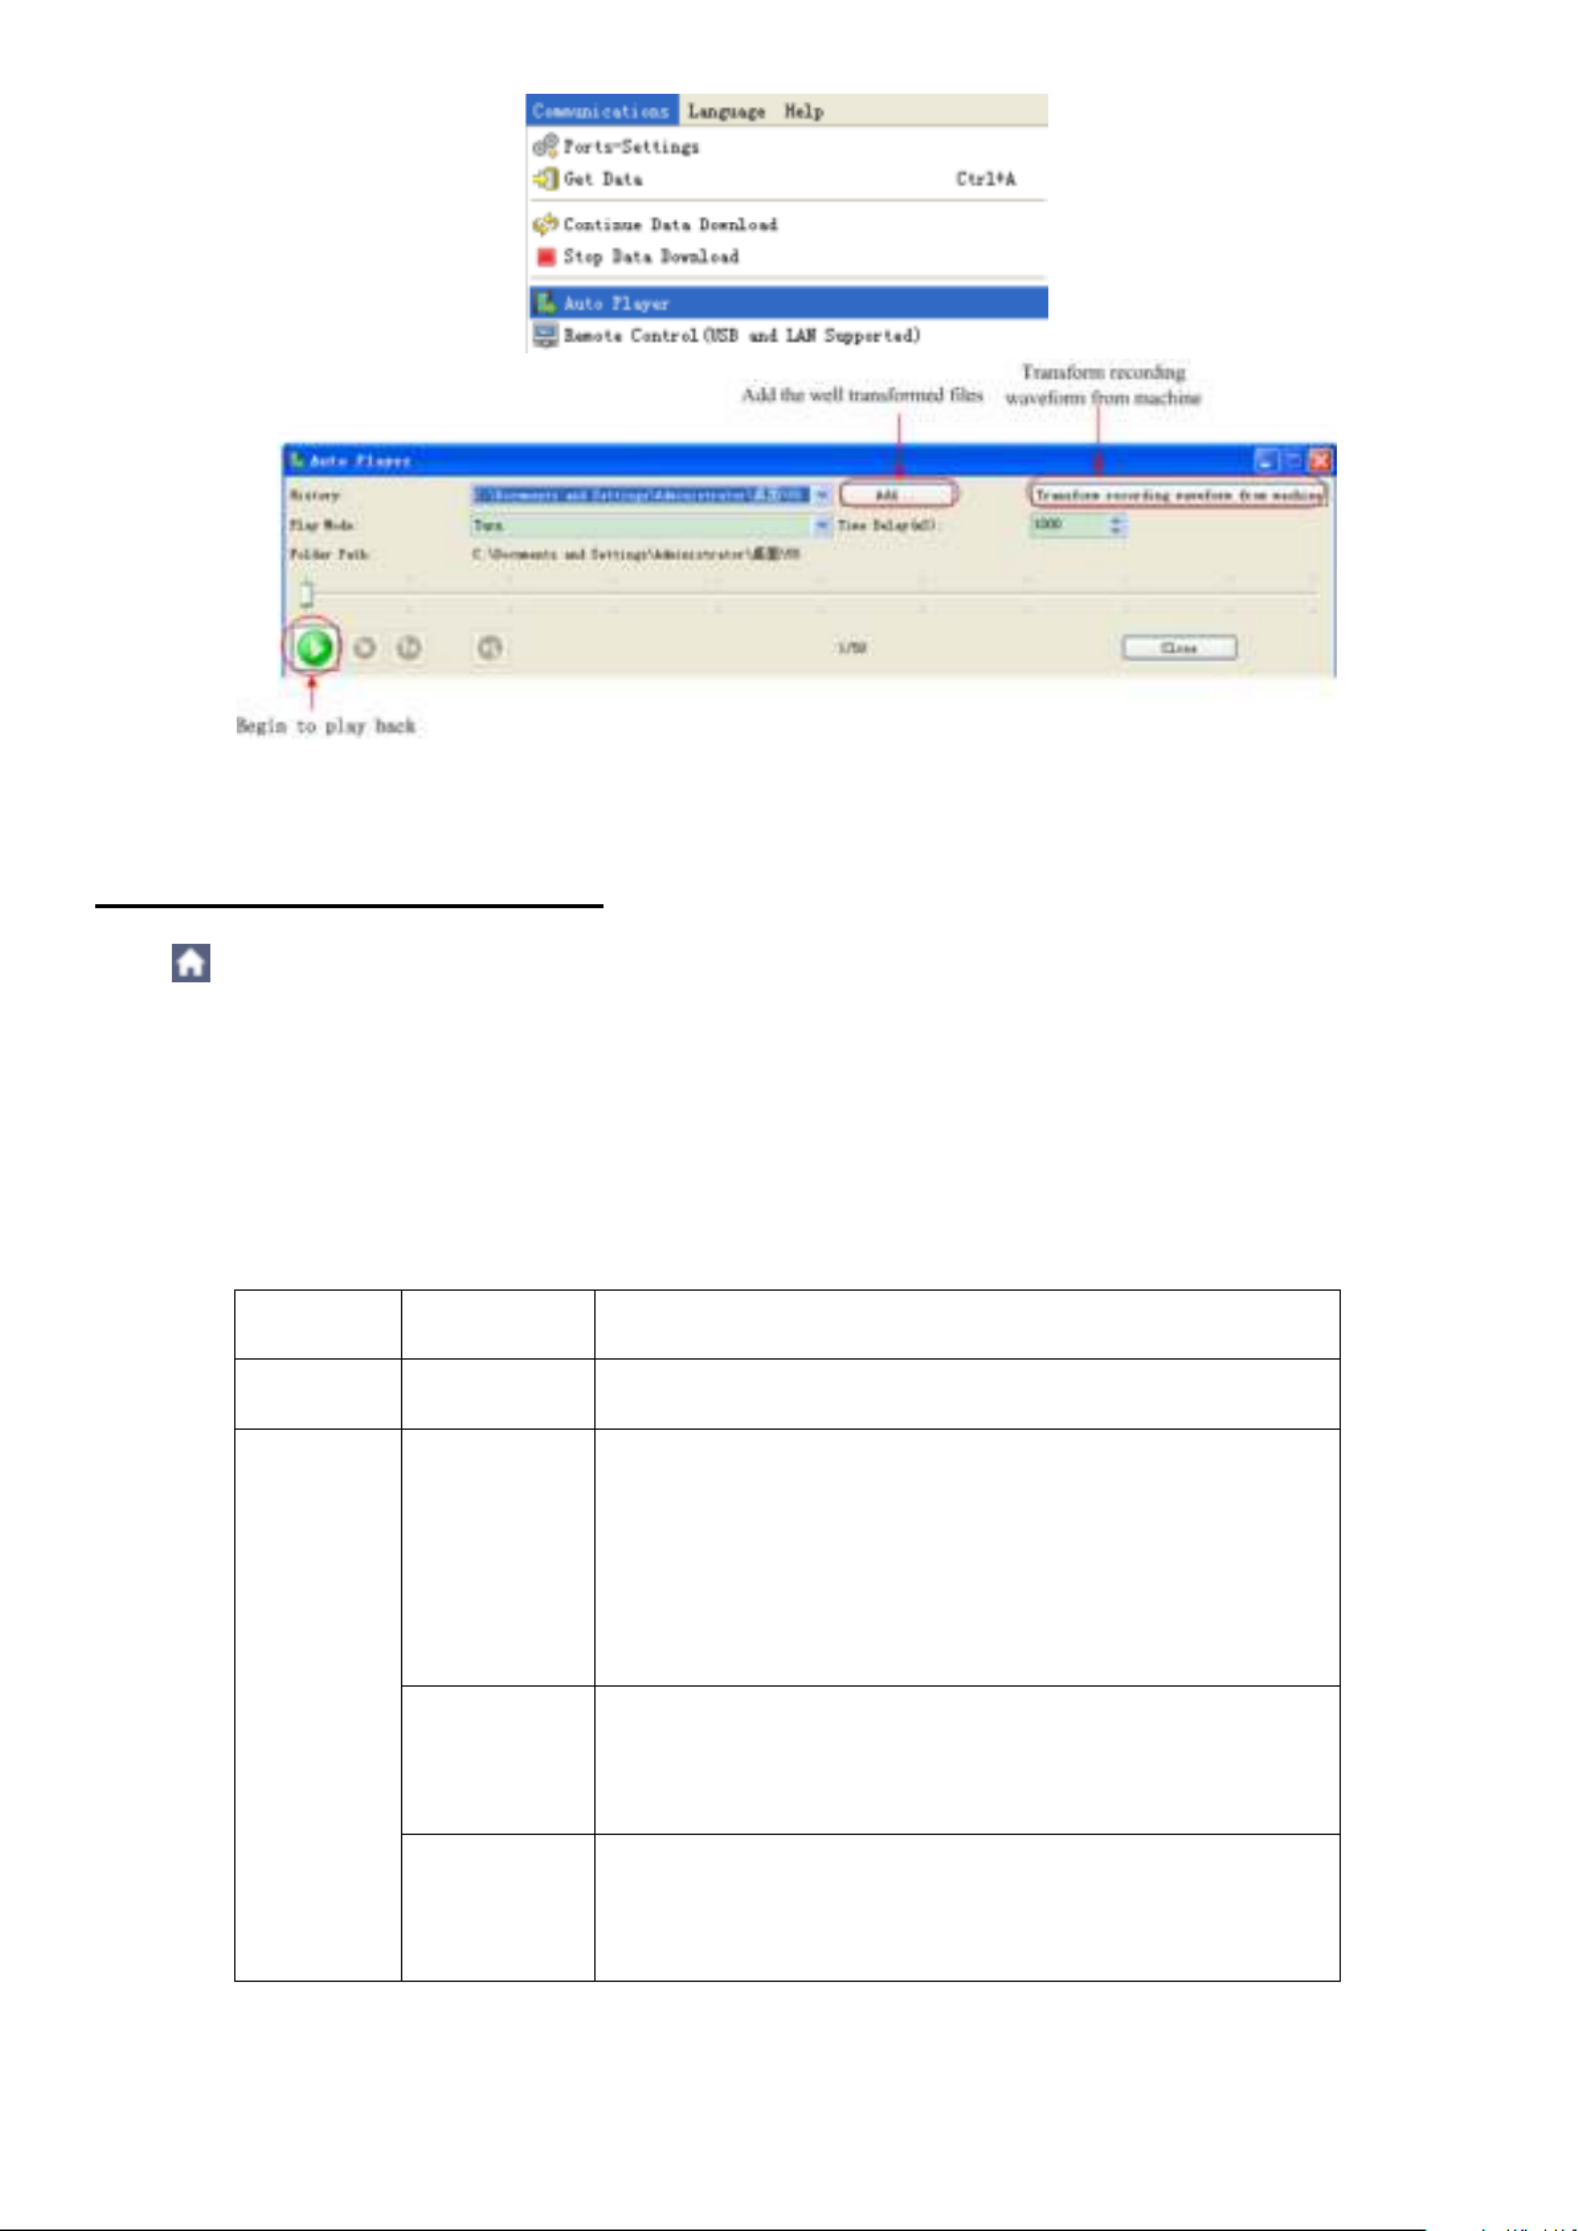
- - 54
Bild 4.10 Wiedergabe der Wellenform mittels der Software
8.2.6 Clone and recall a waveform
Click to call up the menu panel. Click the Save Type softkey on panel. Select in the bottom
menu, select in the left menu. Clone
You can clone one or two channel waveforms between two cursors, and save it as a cloned
waveform into a USB memory device. The cloned waveform files saved to a USB memory device
are saved with the extension "ota".
Clone wave menu:
Menu
Settings
Instruction
Type
Clone
Select the clone function.
Source
Mode
Out1
Out2
Out1&Out2
Select the source mode.
The cloned waveform includes one waveform,
which will be used for AG Out1
The cloned waveform includes one waveform,
which will be used for AG Out2
The cloned waveform includes two waveforms,
which will be used for AG Out1 and AG Out2
AG Output
Out1
CH1 CH2
CH3 CH4
Select the source, which will be used for AG Out1
AG Output
Out2
CH1 CH2
CH3 CH4
Select the source, which will be used for AG Out2
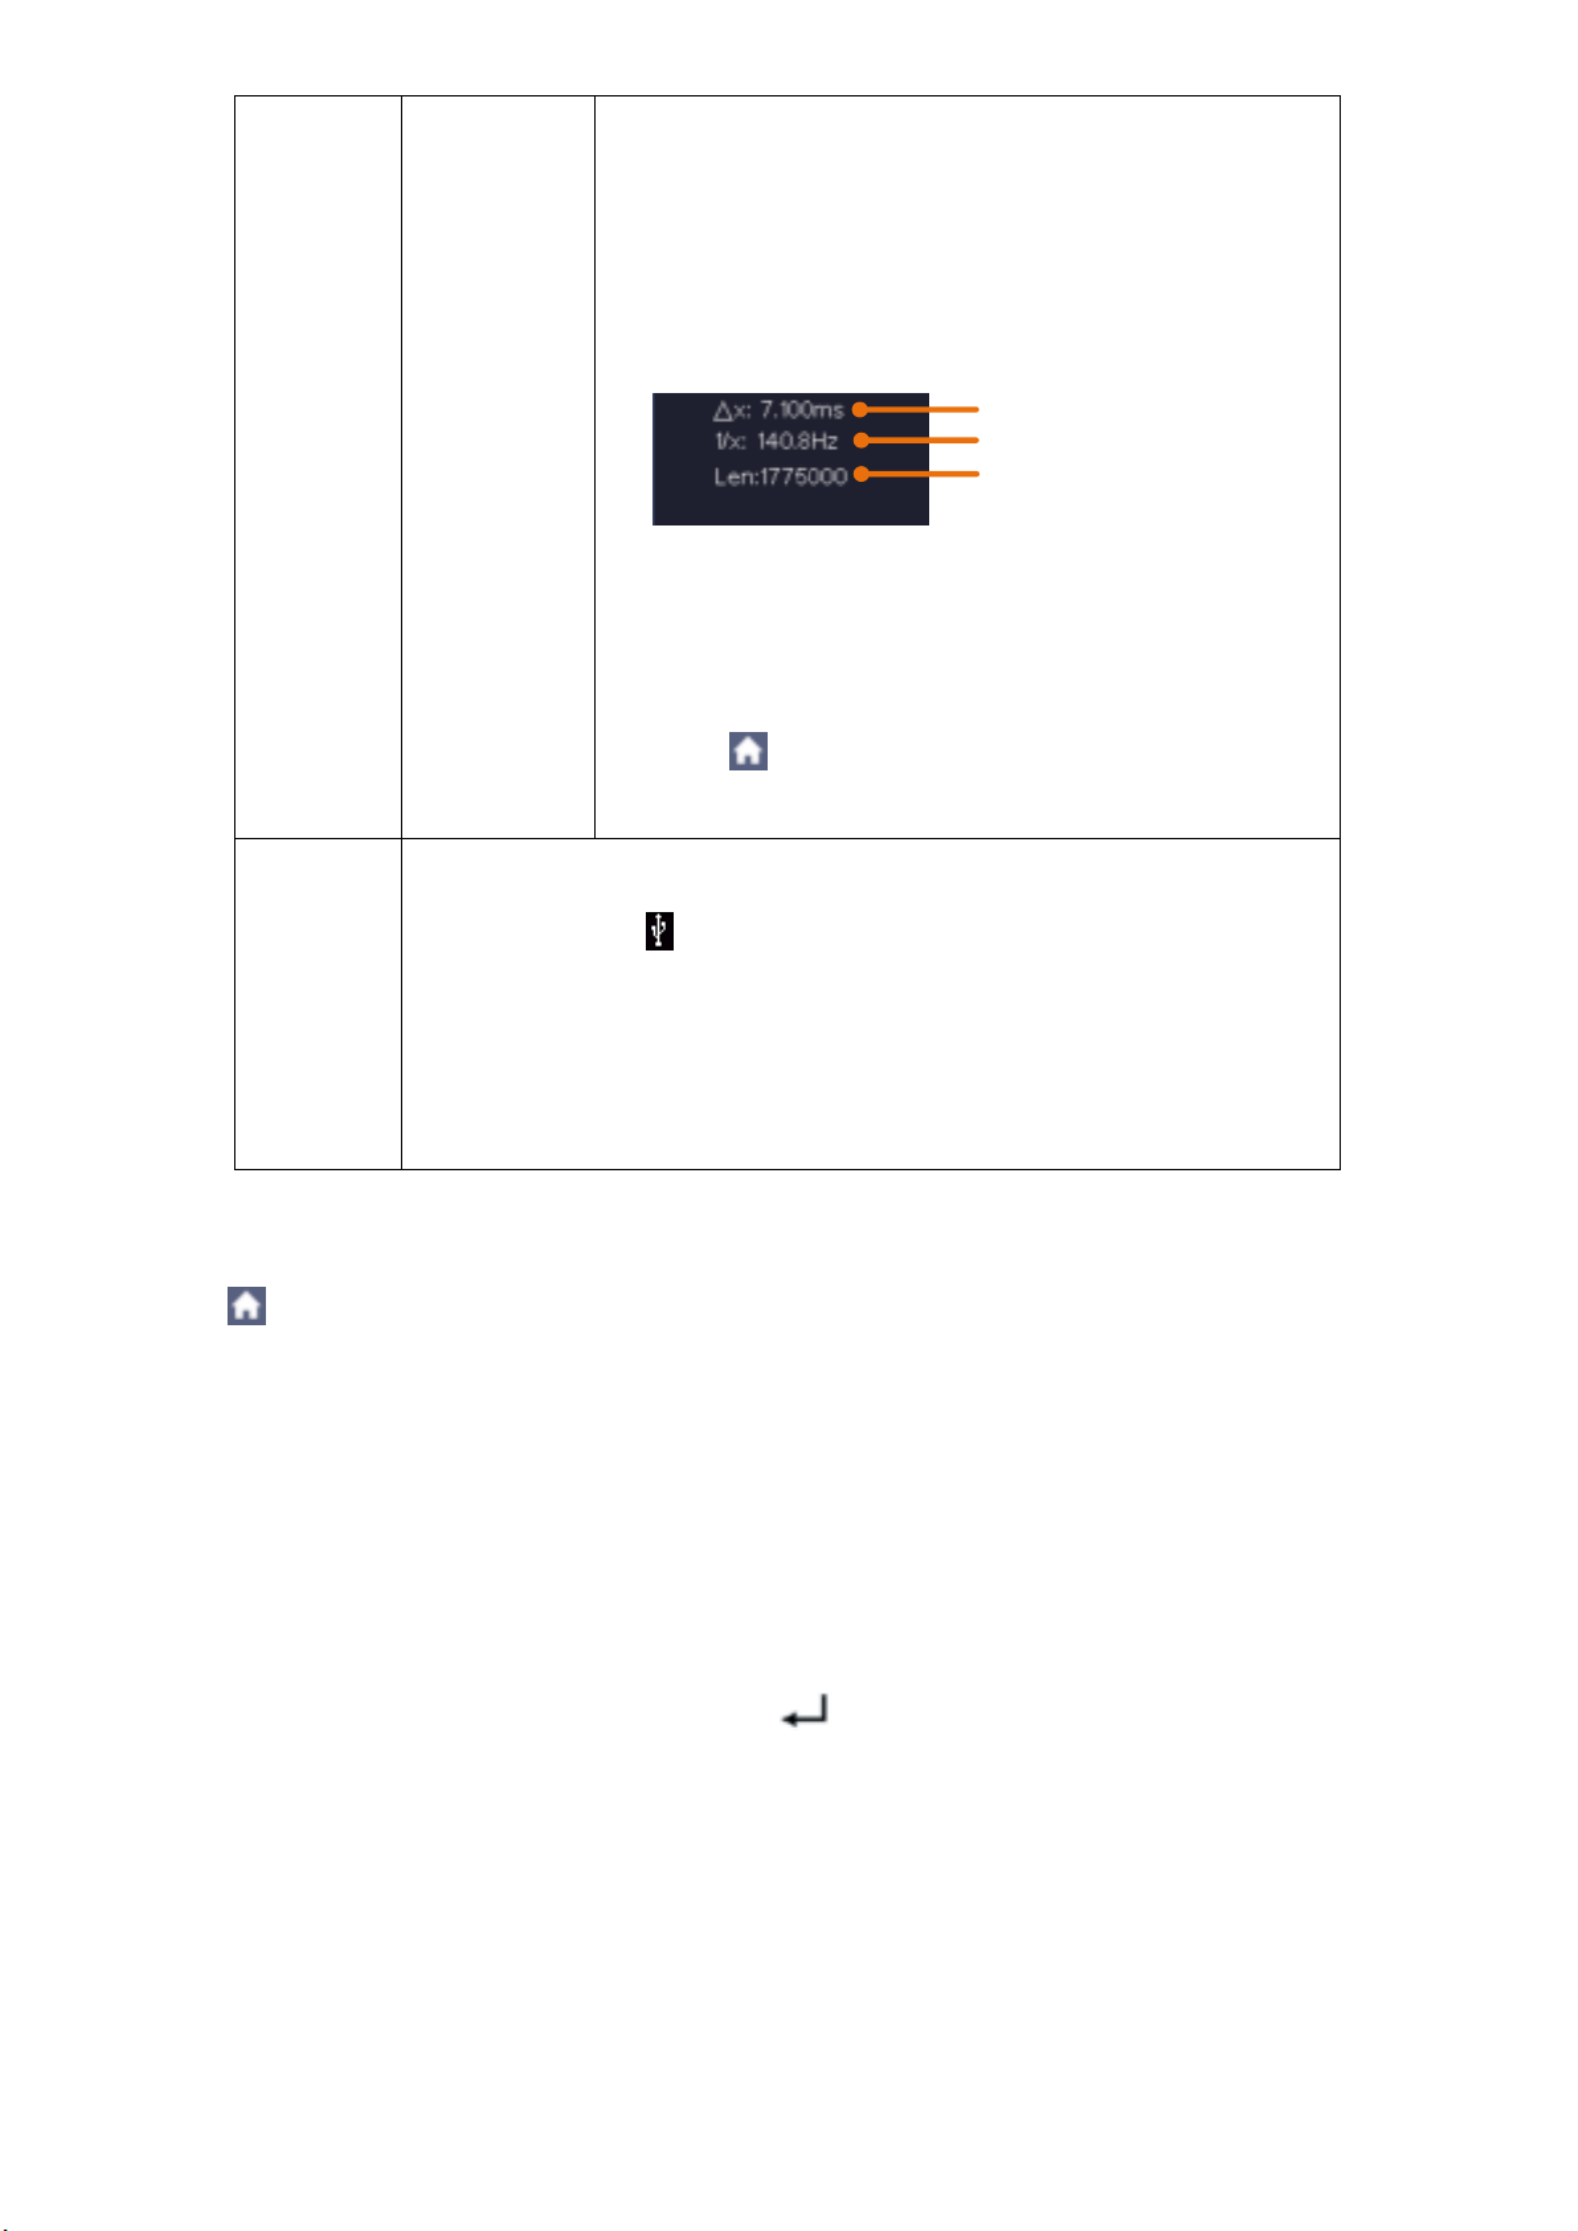
- - 55
Line
a
b
ab
x
Click line to select it, swipe left/right to move . ait
Click line to select it, swipe left/right to move . bit
Two cursors are linked. Click line or to select a b
them, swipe left/right to move the pair of cursors.
Set the cursors to select the entire screen
automatically.
The waveform information is displayed at the left
bottom corner of the screen.
Note Out Of Limits: If " " appears in the information or a
message "Waveform points beyond the limit."
appears on the screen, that means the length of the
cloned waveform exceeds the limit. When the source
mode is Out1 or Out2, the maximum length is 2M; When
the source mode is Out1&Out2, the maximum length is
1M. Click to call up the menu panel. Click the
Acquire softkey on panel, select in the bottom Length
menu, and set the record length to a smaller value.
Save
Save the waveform between two cursors onto a USB memory
device Insert a USB memory device into the port on the side .
panel. If the icon appears on the top right of the screen, the USB
memory device is installed successfully. If the USB memory device
cannot be recognized, format the USB memory device according
to the methods in "Fehler! Verweisquelle konnte nicht gefunden
werden." on P . The name is Fehler! Textmarke nicht definiert.
default as current system date and time. The cloned waveform will
be saved onto the USB memory device as an OTA file.
To save the CH1 waveform and save to the USB memory:
(1) Click to call up the menu panel. Click the softkey on panel. Save
(2) Select in the bottom menu, select in the left menu. Type Clone
(3) Select in the bottom menu, select as in the right menu. Source Mode Out1
(4) Select AG Output Out1 as CH1 in the right menu.
(5) Select Line in the bottom menu. If a or b is selected, swipe to move the cursor. If ab is selected,
swipe to move the pair of cursors. , the entire screen will be selected is selectedIf x
automatically.
(6) Select Save in the bottom menu. An input keyboard used to edit the file name will pop up. Select
the keys to input the file name, select the key in the keyboard to confirm. The cloned
waveform will be saved onto the USB memory device as an OTA file.
Length
Frequency
Time

- - 56
8.2.7 Data format description of OTA waveform file
If the source mode is set to Out1 or Out2, OTA file consists of two parts: the file header and the
channel data. If the source mode is set to Out1&Out2, OTA file consists of three parts: file header,
the first channel data, and the second channel data. The file header represents the parameter of
file data, which is expressed in "parameter name + value". Each parameter name is a case-
sensitive string of 4 bytes. The parameter value is at least 4 bytes.
1. Format description oft he file header:
1) HEAD
Parameter name
Meaning
Value
Comment
HEAD
Header size
4 bytes int
2) TYPE
Parameter name
Meaning
Value
Comment
Type
Model
12 bytes char
3) BYTE
Parameter name
Meaning
Value
Comment
Byte
Data length in bit
4 bytes int
4) SIZE
Parameter name
Meaning
Value
Comment
Size
File size
4 bytes int
Used to check the file
integrity
5) VOLT
Parameter name
Meaning
Value
Comment
Volt
Voltage division, divided
by 400 is ADC resolution
(When the source mode
is Out 1 & Out 2, it ist he
first Channel voltage
division
4 bytes float
The value indicates
the voltage (the unit
is mV), such as 200
mV
6) SAMP
Parameter name
Meaning
Value
Comment
Samp
Samp Rate le
4 bytes float
The unit is Sa/s
7) ADCB
Parameter name
Meaning
Value
Comment
ADCB
ADC bit, ADC
resolution
4 bytes int
8-bit or -bit 12
8) CHAN
Parameter name
Meaning
Value
Comment
Chan
Number of
Channnels
4 bytes int
1 o 2 r
- - 57
9) VOL2
Parameter name
Meaning
Value
Comment
VOL2
Voltage division,
divided by 400 is
ADC resolution
(When the source
mode is Out 1 & Out
2, it ist p58-he second
channel voltage
division)
4 bytes float
The value indicates
the voltage (the unit
is mV), such as 200
mV
2.Data
The data type is signed integer. You can determine the data type (char, short int or int) based on the BYTE
parameter. The valid range is determined by the ADCB parameter, e.g. the valid range for 8-bit ADC is -
127 to +127.
9. Measurement functions
9.1 Measure automatically
Click to call up the menu panel. Click the softkey on panel to display the Measure Measure
menu. At most 8 types of measurements could be displayed on the bottom left of the screen.
The oscilloscopes provide 39 parameters for auto measurement, including Period, Frequency,
Mean, PK-PK, RMS, Max, Min, Top, Base, Amplitude, Overshoot, Preshoot, Rise Time, Fall Time,
+PulseWidth, -PulseWidth, +Duty Cycle, -Duty Cycle, Screen Duty, FRR, FRF, FFR, FFF, LRR,
LRF, LFR, LFF, Delay A→B , Delay A→B , Cycle RMS, Cursor RMS, FRR, FRF, FFR, FFF,
LRR, LRF, LFR, LFF, Phase A→B , Phase A→B , +PulseCount, -PulseCount, RiseEdgeCnt,
FallEdgeCnt, Area, and Cycle Area.
The "Automatic Measurements" menu is described in the following table:
Function Menu
Description
Add
Meas Type
(left menu)
Select the measure types
Source
CH1 CH2
CH3 CH4
Select the source
Add
Add the selected measure types (shown at the
left bottom, you could only add 8 types at most)
Remove
Meas Type
Select the types need to be deleted.

- - 58
(left menu)
The selected type and source are shown in the
Remove menu on the right.
Remove
Remove the selected measure type
Remove
All
Remove all the measures
Snapshot
ON
OFF
Show all the measures of the snapshot source
Turn off the snapshot
Source
CH1
CH2
CH3
CH4
Select the snapshot source
9.1.1 Measure
Only if the waveform channel is in the ON state, the measurement can be performed. The automatic
measurement cannot be performed in the following situation:
1) On the saved waveform
2) On Waveform Math waveform
3) On the video trigger mode
On the Scan format, period or frequency cannot be measured.
To measure the period or the frequency of CH 1, follow the steps below:
1. Click to call up the menu panel. Click the softkey on panel to show the automatic Measure
measurement function menu
2. Select Add in the bottom menu
3. In the left Type menu, select Period
4. In the right menu, select as Source CH1
5. In the right menu, select Add. The period type is added
6. In the left Type menu, select Frequency
7. In the right menu, select as Source CH1
8. In the right menu, select Add. The frequency type is added
The measured value will be displayed at the bottom left of the screen automatically (see fig. 4.11)
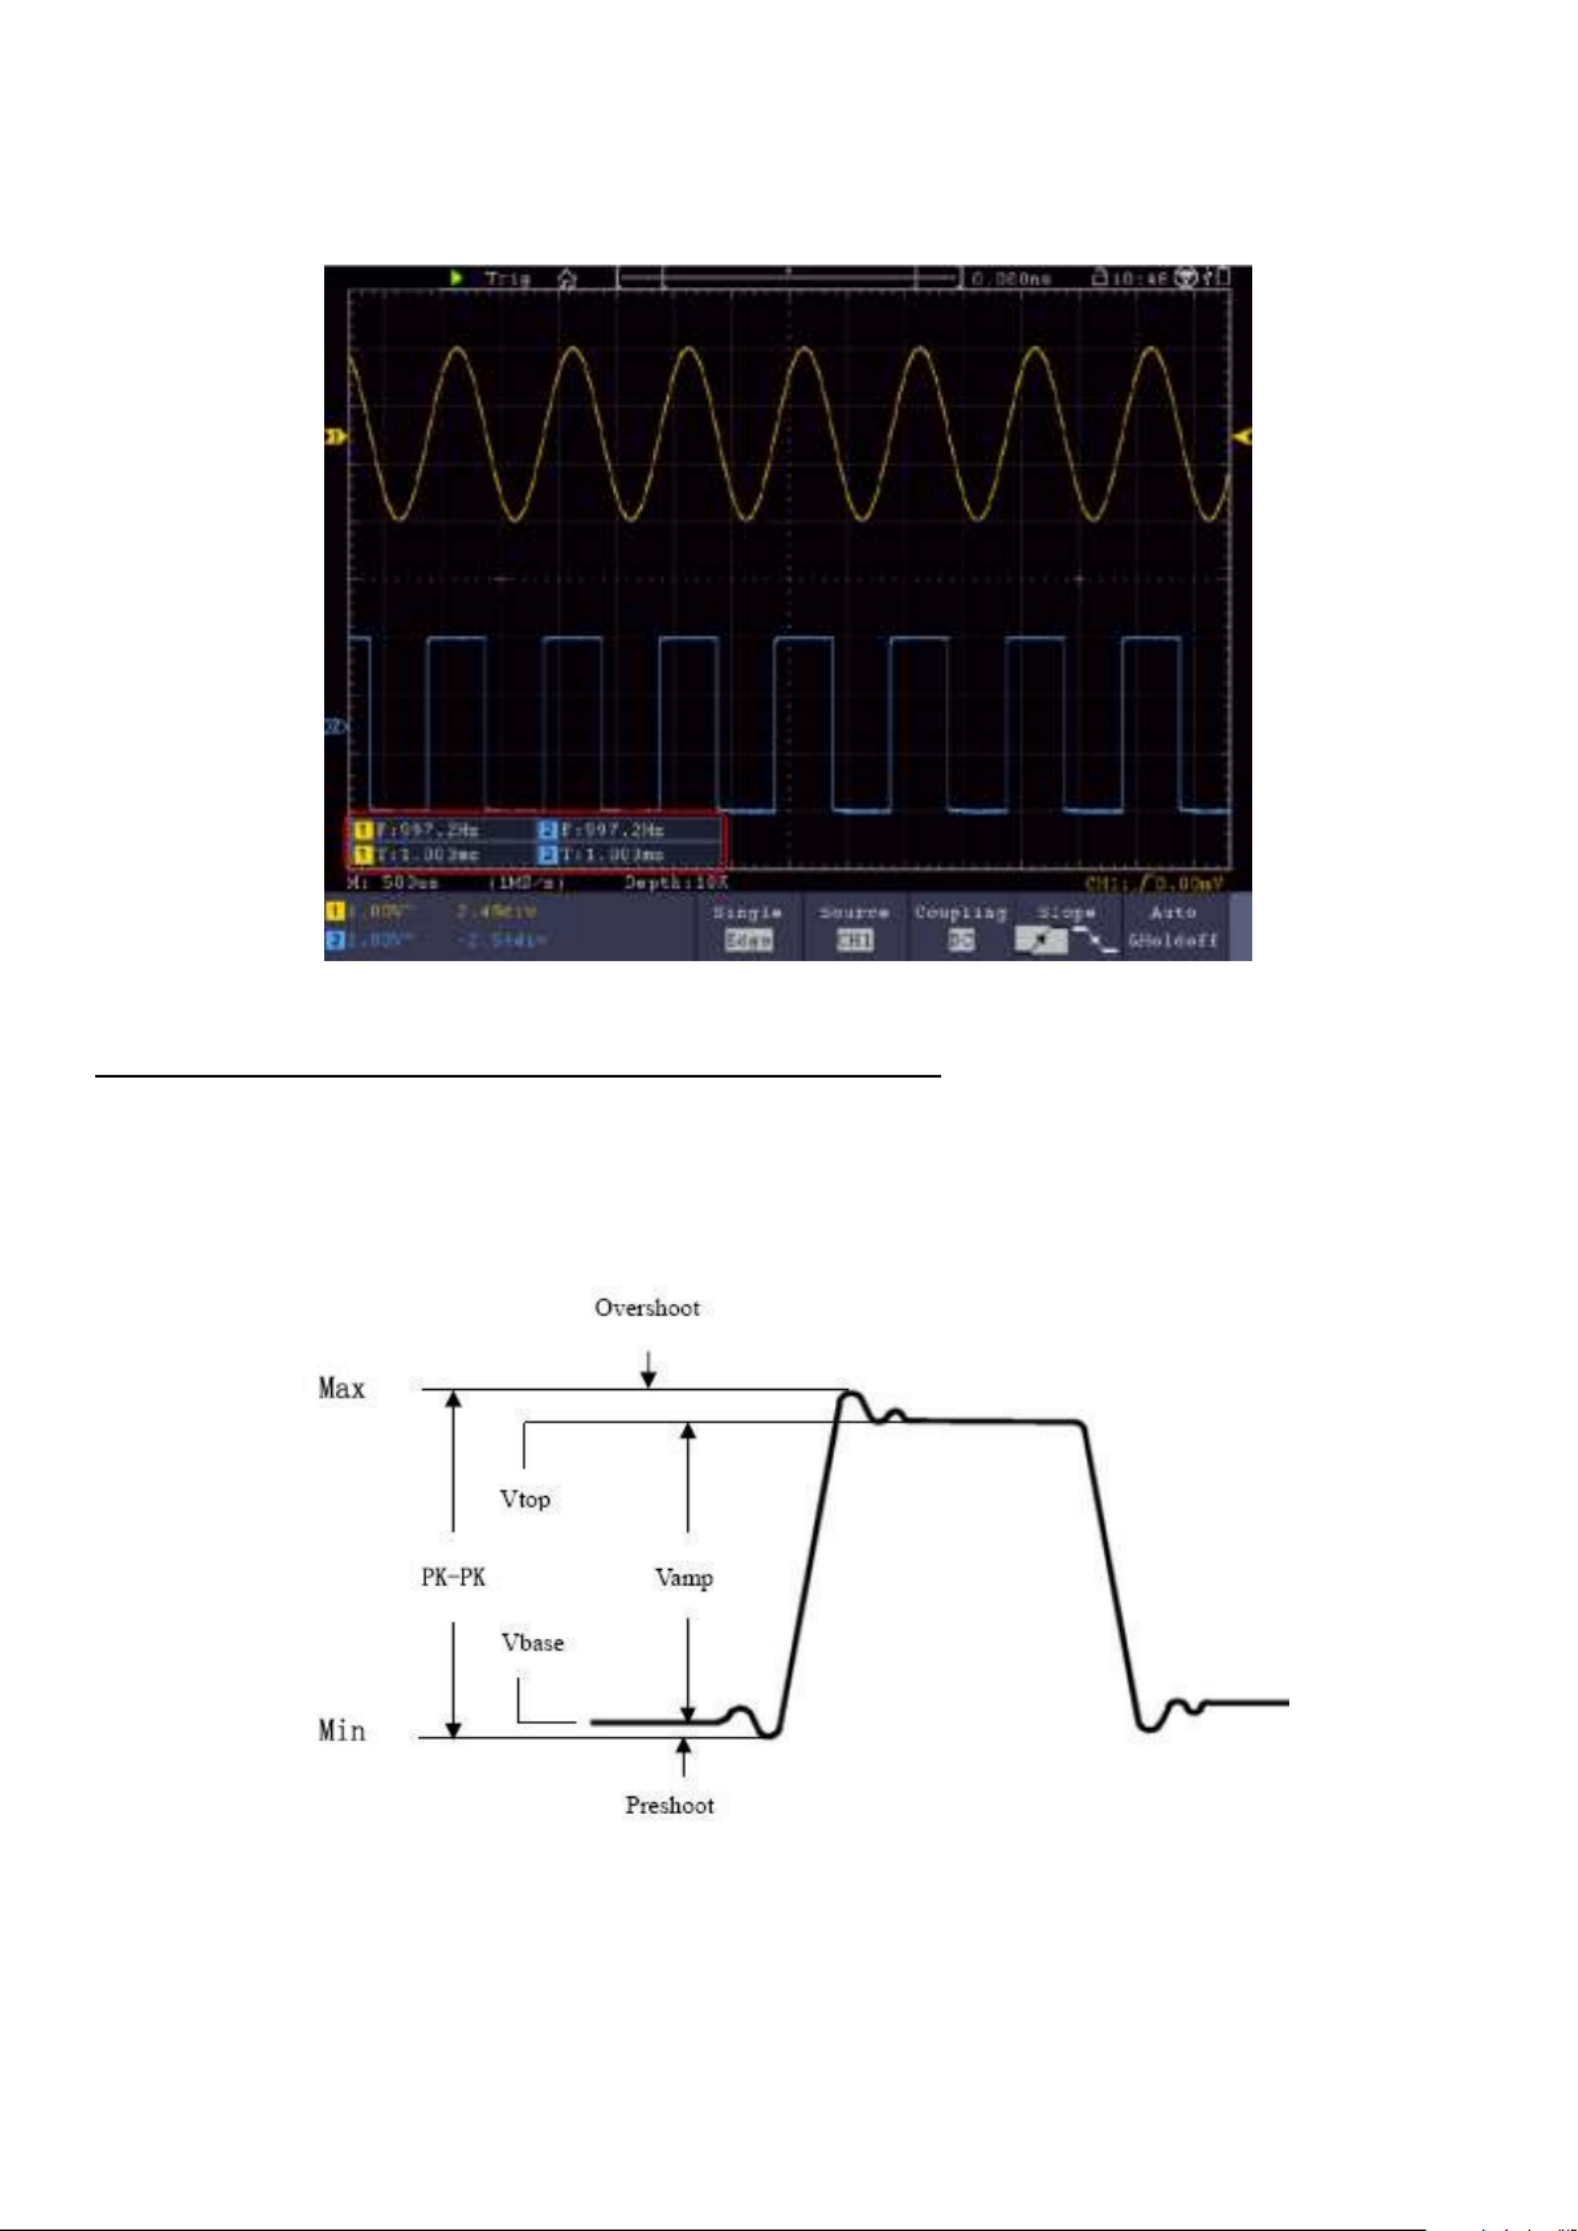
- - 59
Fig. 4.11 Automatic measurement
9.1.2 Automatic measurement of the voltage parameters
The oscilloscopes provide automatic voltage measurements including Mean, PK-PK, RMS, Max,
Min, Vtop, Vbase, Vamp, OverShoot, PreShoot, Figure 4.12 Cycle RMS, and Cursor RMS.
shows a pulse with some of the voltage measurement points.
Fig. 4.12 Explanation of the parameters
Mean: The arithmetic mean over the entire waveform
PK-PK: Peak to peak voltage
RMS: The true Root Mean Square voltage over the entire waveform.
Max: The maximum amplitude. The most positive peak voltage measured over the entire waveform.
Min: The minimum amplitude. The most negative peak voltage measured over the entire waveform.
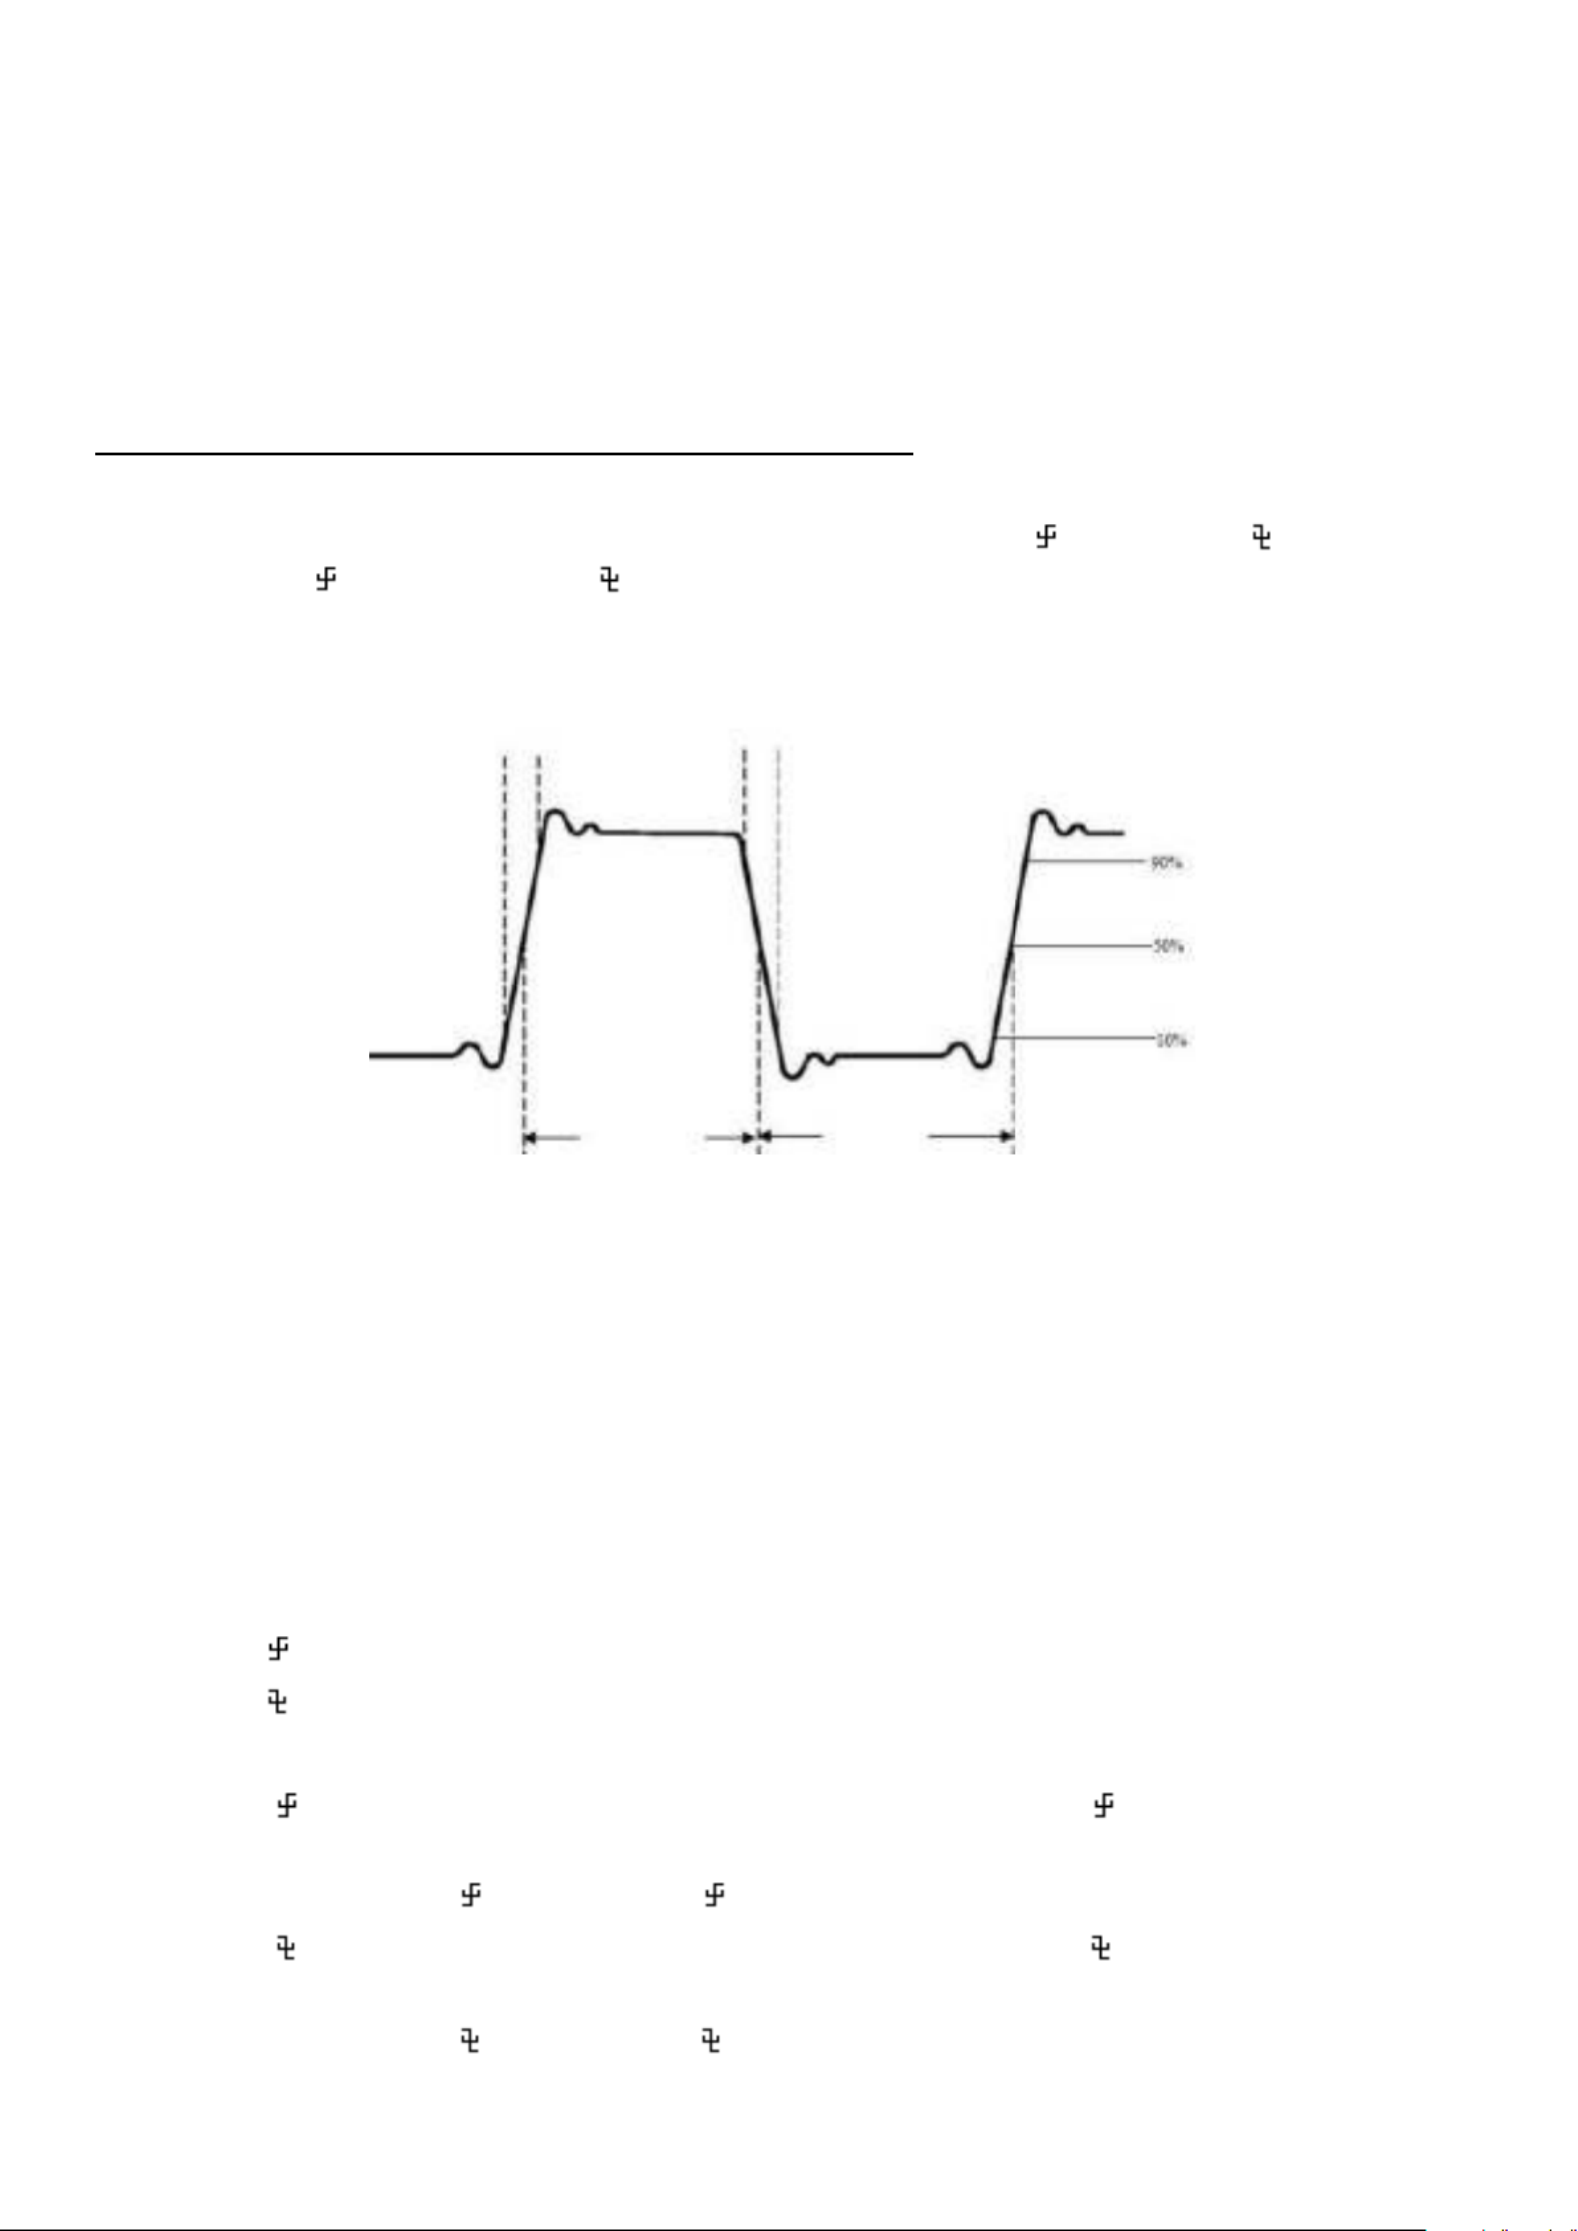
- - 60
Vtop: Voltage of the waveform's flat top, useful for square/pulse waveforms.
Vbase: Voltage of the waveform's flat base, useful for square/pulse waveforms.
Vamp: Voltage between Vtop and Vbase of a waveform.
Overshoot: Defined as (Vmax-Vtop)/Vamp, useful for square and pulse waveforms.
Preshoot: Defined as (Vmin-Vbase)/Vamp, useful for square and pulse waveforms.
Cycle RMS: The true Root Mean Square voltage over the first entire period of the waveform.
Cursor RMS: The true Root Mean Square voltage over the range of two cursors.
9.1.3 Automatic measurements of the time parameters
The oscilloscopes provide time parameters auto-measurements include Period, Frequency, Rise
Time, Fall Time, +D width, -D width, +Duty, -Duty, Delay A→B , Delay A→B , Screen Duty,
Phase A→B , and Phase , FRR, FRF, FFR, FFF, LRR, LRF, LFR, LFF. A→B
Figure 4.13 shows a pulse with some of the time measurement points:
Fig. 4.13 Explanation of the parameters
Rise Time: Time that the leading edge of the first pulse in the waveform takes to rise from 10% to
90% of its amplitude.
Fall Time: Time that the falling edge of the first pulse in the waveform takes to fall from 90% to
10% of its amplitude.
+D width: The width of the first positive pulse in 50% amplitude points.
-D width: The width of the first negative pulse in the 50% amplitude points.
+Duty: +Duty Cycle, defined as +Width/Period.
-Duty:-Duty Cycle, defined as -Width/Period.
Delay :A→B The delay between the two channels at the rising edge.
Delay A→B : The delay between the two channels at the falling edge.
Screen Duty: Defines as (the width of the positive pulse)/(Entire period)
Phase :A→B Phase difference calculated according to " Delay " and the period of A→B
source A, expressed in degree. The calculation formula is as shown below:
Phase Delay A→B = ( A→B ÷ Period of source A) × 360°
Phase :A→B Phase difference calculated according to " Delay " and the period of source A→B
A, expressed in degree. The calculation formula is as shown below:
Phase Delay A→B = ( A→B ÷ Period of source A) × 360°
Rise Time Fall Time
+Width -Width
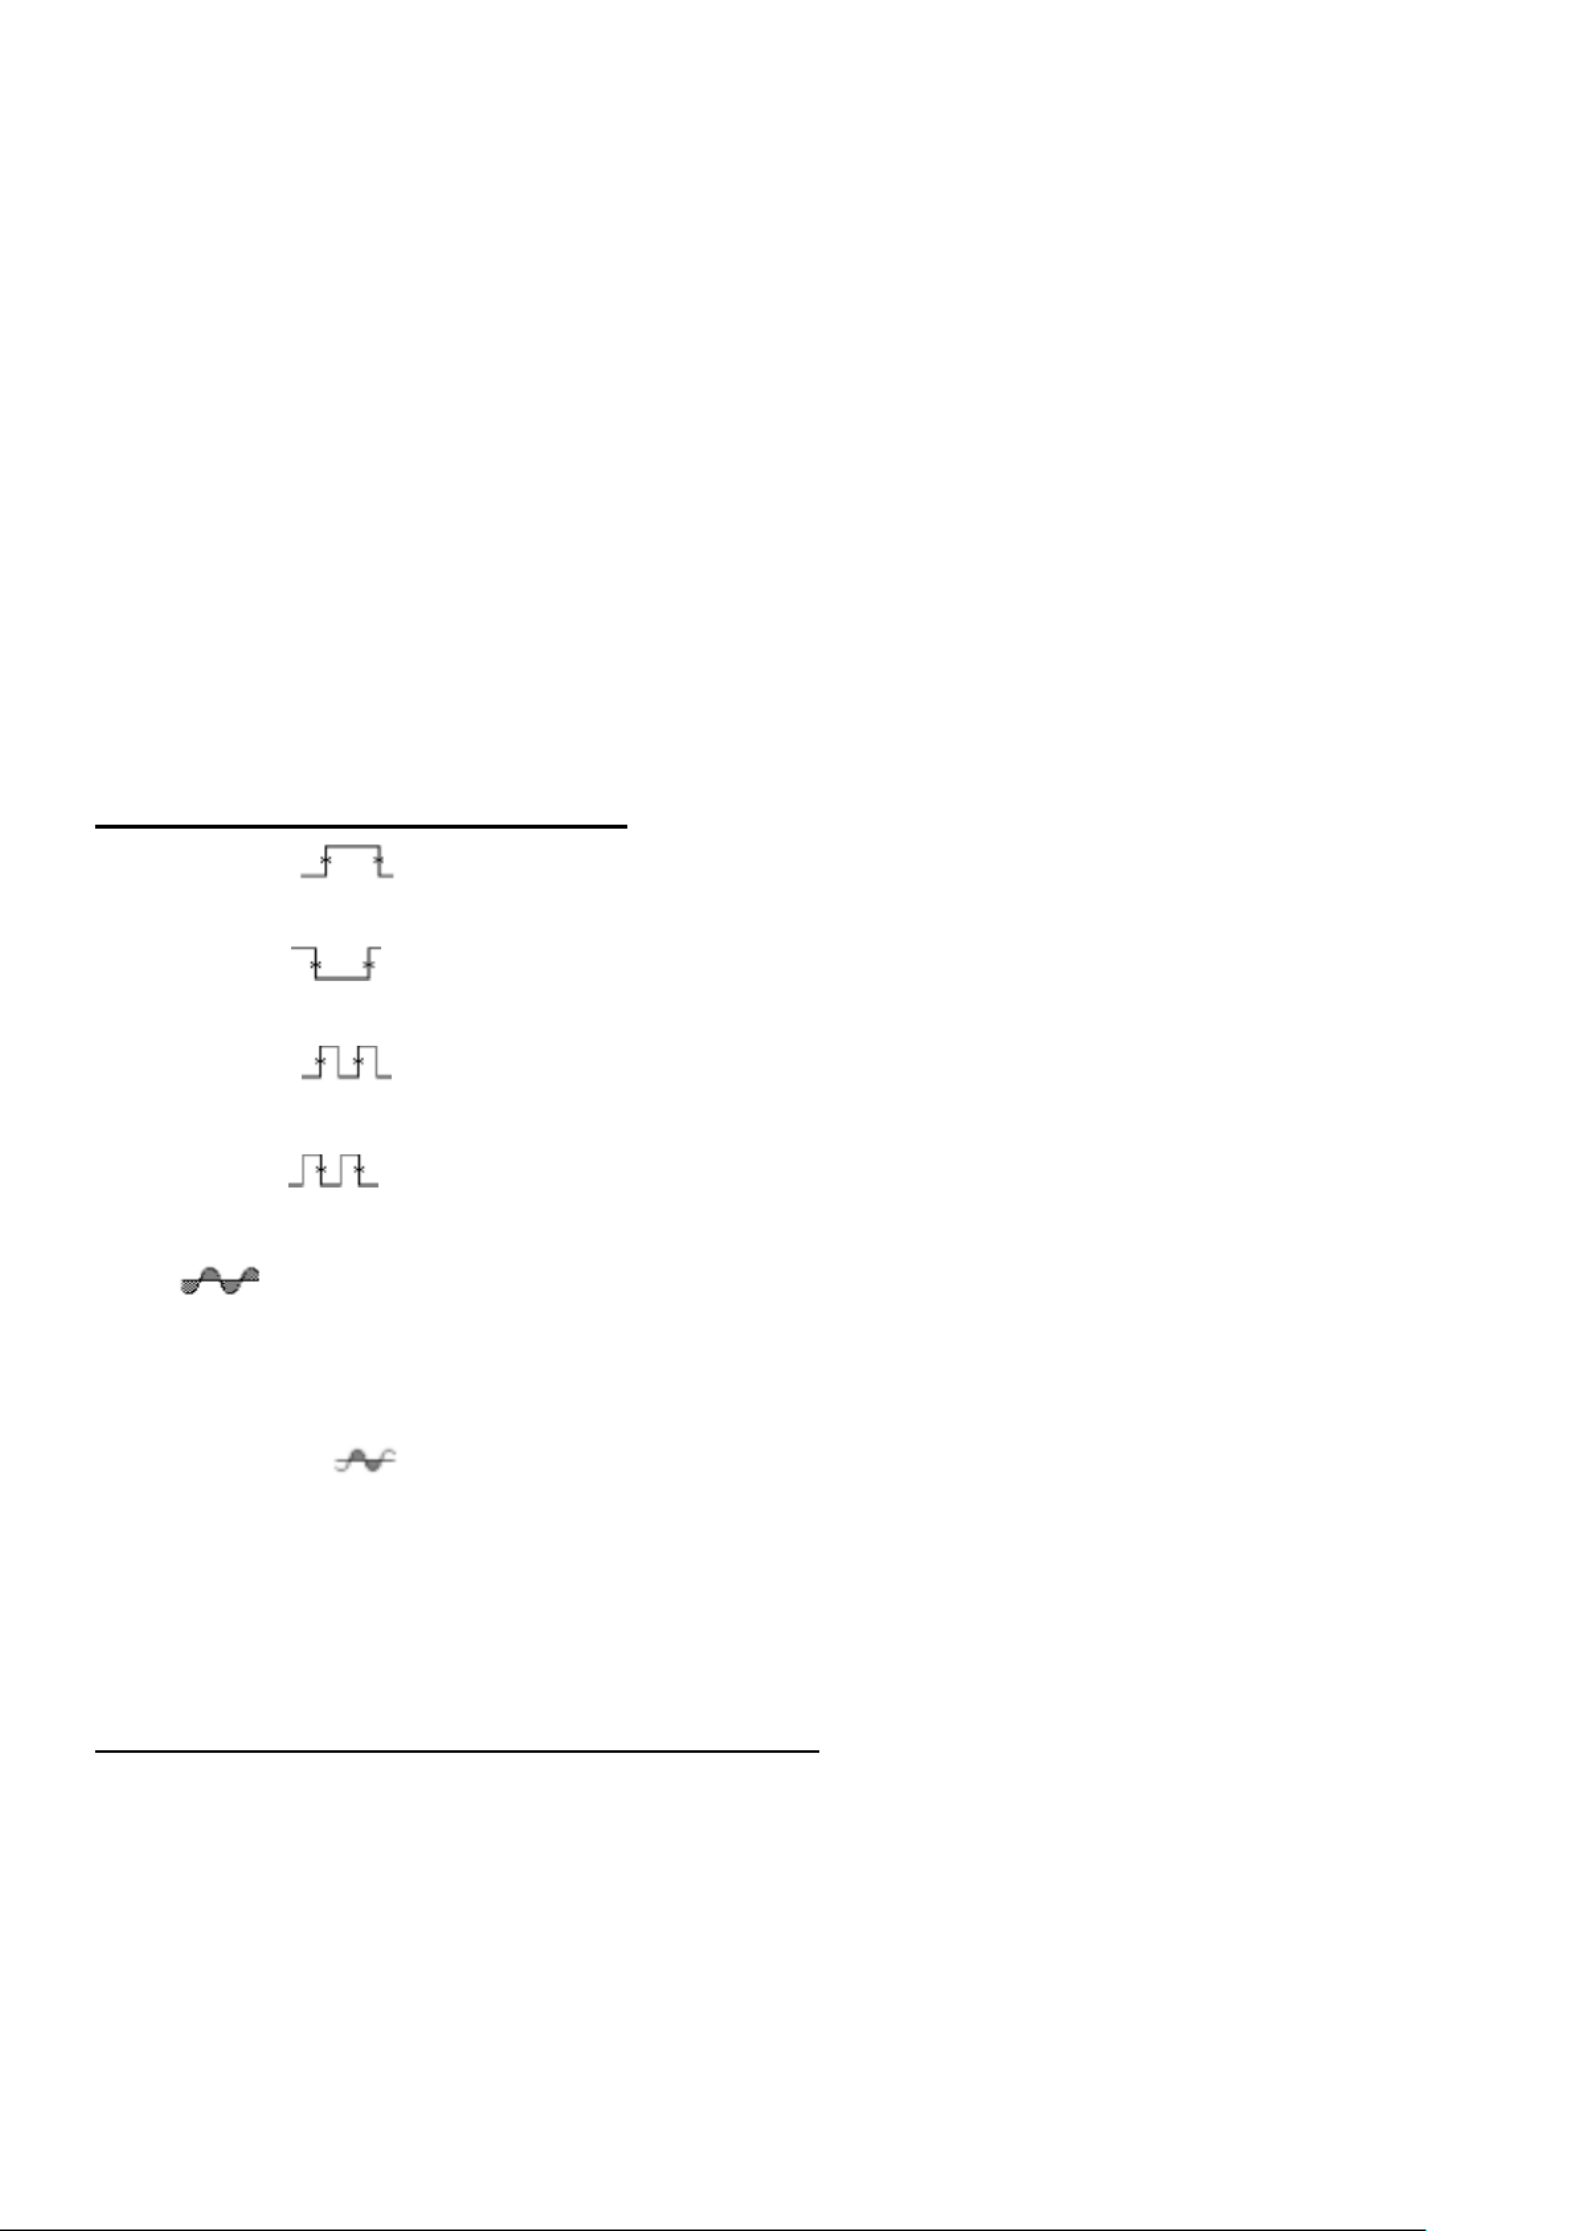
- - 61
Note for the following delay measurements:
Source A and Source B can be set in the automatic measurement function menu.
FRR: Time between Source A first rising edge and Source B first rising edge.
FRF: Time between Source A first rising edge and Source B first falling edge.
FFR: Time between Source A first falling edge and Source B first rising edge.
FFF: Time between Source A first falling edge and Source B first falling edge.
LRR: Time between Source A first rising edge and Source B last rising edge.
LRF: Time between Source A first rising edge and Source B last falling edge.
LFR: Time between Source A first falling edge and Source B last rising edge.
LFF: Time between Source A first falling edge and Source B last falling edge.
9.1.4 Other measurement functions
+PulseCount : The number of positive pulses that rise above the mid reference crossing in
the waveform.
-PulseCount : The number of negative pulses that fall below the mid reference crossing in
the waveform.
RiseEdgeCnt : The number of positive transitions from the low reference value to the high
reference value in the waveform.
FallEdgeCnt : The number of negative transitions from the high reference value to the low
reference value in the waveform.
Area : The area of the whole waveform within the screen and the unit is voltage-second.
The area measured above the zero reference (namely the vertical offset) is positive; the area
measured below the zero reference is negative. The area measured is the algebraic sum of the
area of the whole waveform within the screen.
Cycle Area : The area of the first period of waveform on the screen and the unit is
voltage-second. The area above the zero reference (namely the vertical offset) is positive and the
area below the zero reference is negative. The area measured is the algebraic sum of the area of
the whole period waveform.
Note: When the waveform on the screen is less than a period, the period area measured is 0.
9.1.5 Adjustment of the automatic measurement
This chapter explains how it is possible to adapt the automatic measurement.
Adjust an automatic measurement using the gating and statistics functions as follows:
Gating
Press the measuring system under the TrigMenu tab. The menu for the automatic
measurement function is displayed at the bottom of the screen.
Press the Set button at the bottom of the screen. The settings menu is displayed on the
right side of the screen.

- - 62
Select the gating menu. There are two menus: Screen and Cursor under the area. Click
Screen, then click the cursor or press the right on-screen menu key twice to set the cursor
area.
Statistics
Choose Statistics. You can select On or Off to enable or disable statistics on the reading.
Reset statistics: Restart the statistics.
9.2 Measure with the Cursors
Click to call up the menu panel. Click the softkey on panel to switch to the ON state Cursor
and display the cursor menu. Click it again to turn cursors off.
Cursor measurement for the normal mode:
The description of the is shown the following table: cursor menu in
Function
Menu
Settings
Description
Type
Voltage
Time
Time&Voltage
AutoCursr
Display the voltage measurement cursor and menu.
Display the time measurement cursor and menu.
Display the time and voltage measurement cursor and
menu.
The horizontal cursors are set as the intersections of the
vertical cursors and the waveform
Line Type
(Time&Voltage
type)
Time
Voltage
Makes the vertical cursors active.
Makes the horizontal cursors active.
Window
(Wave zoom
mode)
Main
Extension
Measure in the main window.
Measure in the extension window.
Source
CH1 to CH4
Display the channel to which the cursor measurement
will be applied.
Perform the following operation steps for the time and voltage cursor measurement of the channel
CH1:
1. Click to call up the menu panel. Click the softkey on panel to switch to the Cursor ON
state and display the cursor menu.
2. Select in the bottom menu, select in the right menu. Source CH1
3. Select the first menu item in the bottom menu, the menu will display at the right of the Type
screen. In the right menu, select for Type, two blue dotted lines displayed Time&Voltage
along the horizontal direction of the screen, two blue dotted lines displayed along the vertical
direction of the screen. Cursor measure window at the left bottom of the screen shows the
cursor readout.
4. In the bottom menu, select Line Type as Time to make the vertical cursors active. Click line
a b to select it, swipe left/right to move . Click line it to select it, swipe left/right to move . it
5. In the bottom menu, select as to make the horizontal cursors active. Line Type Voltage
Click line to select it, swipe /down to move . Click line to select it, swipe /down to aup it bup
move . it
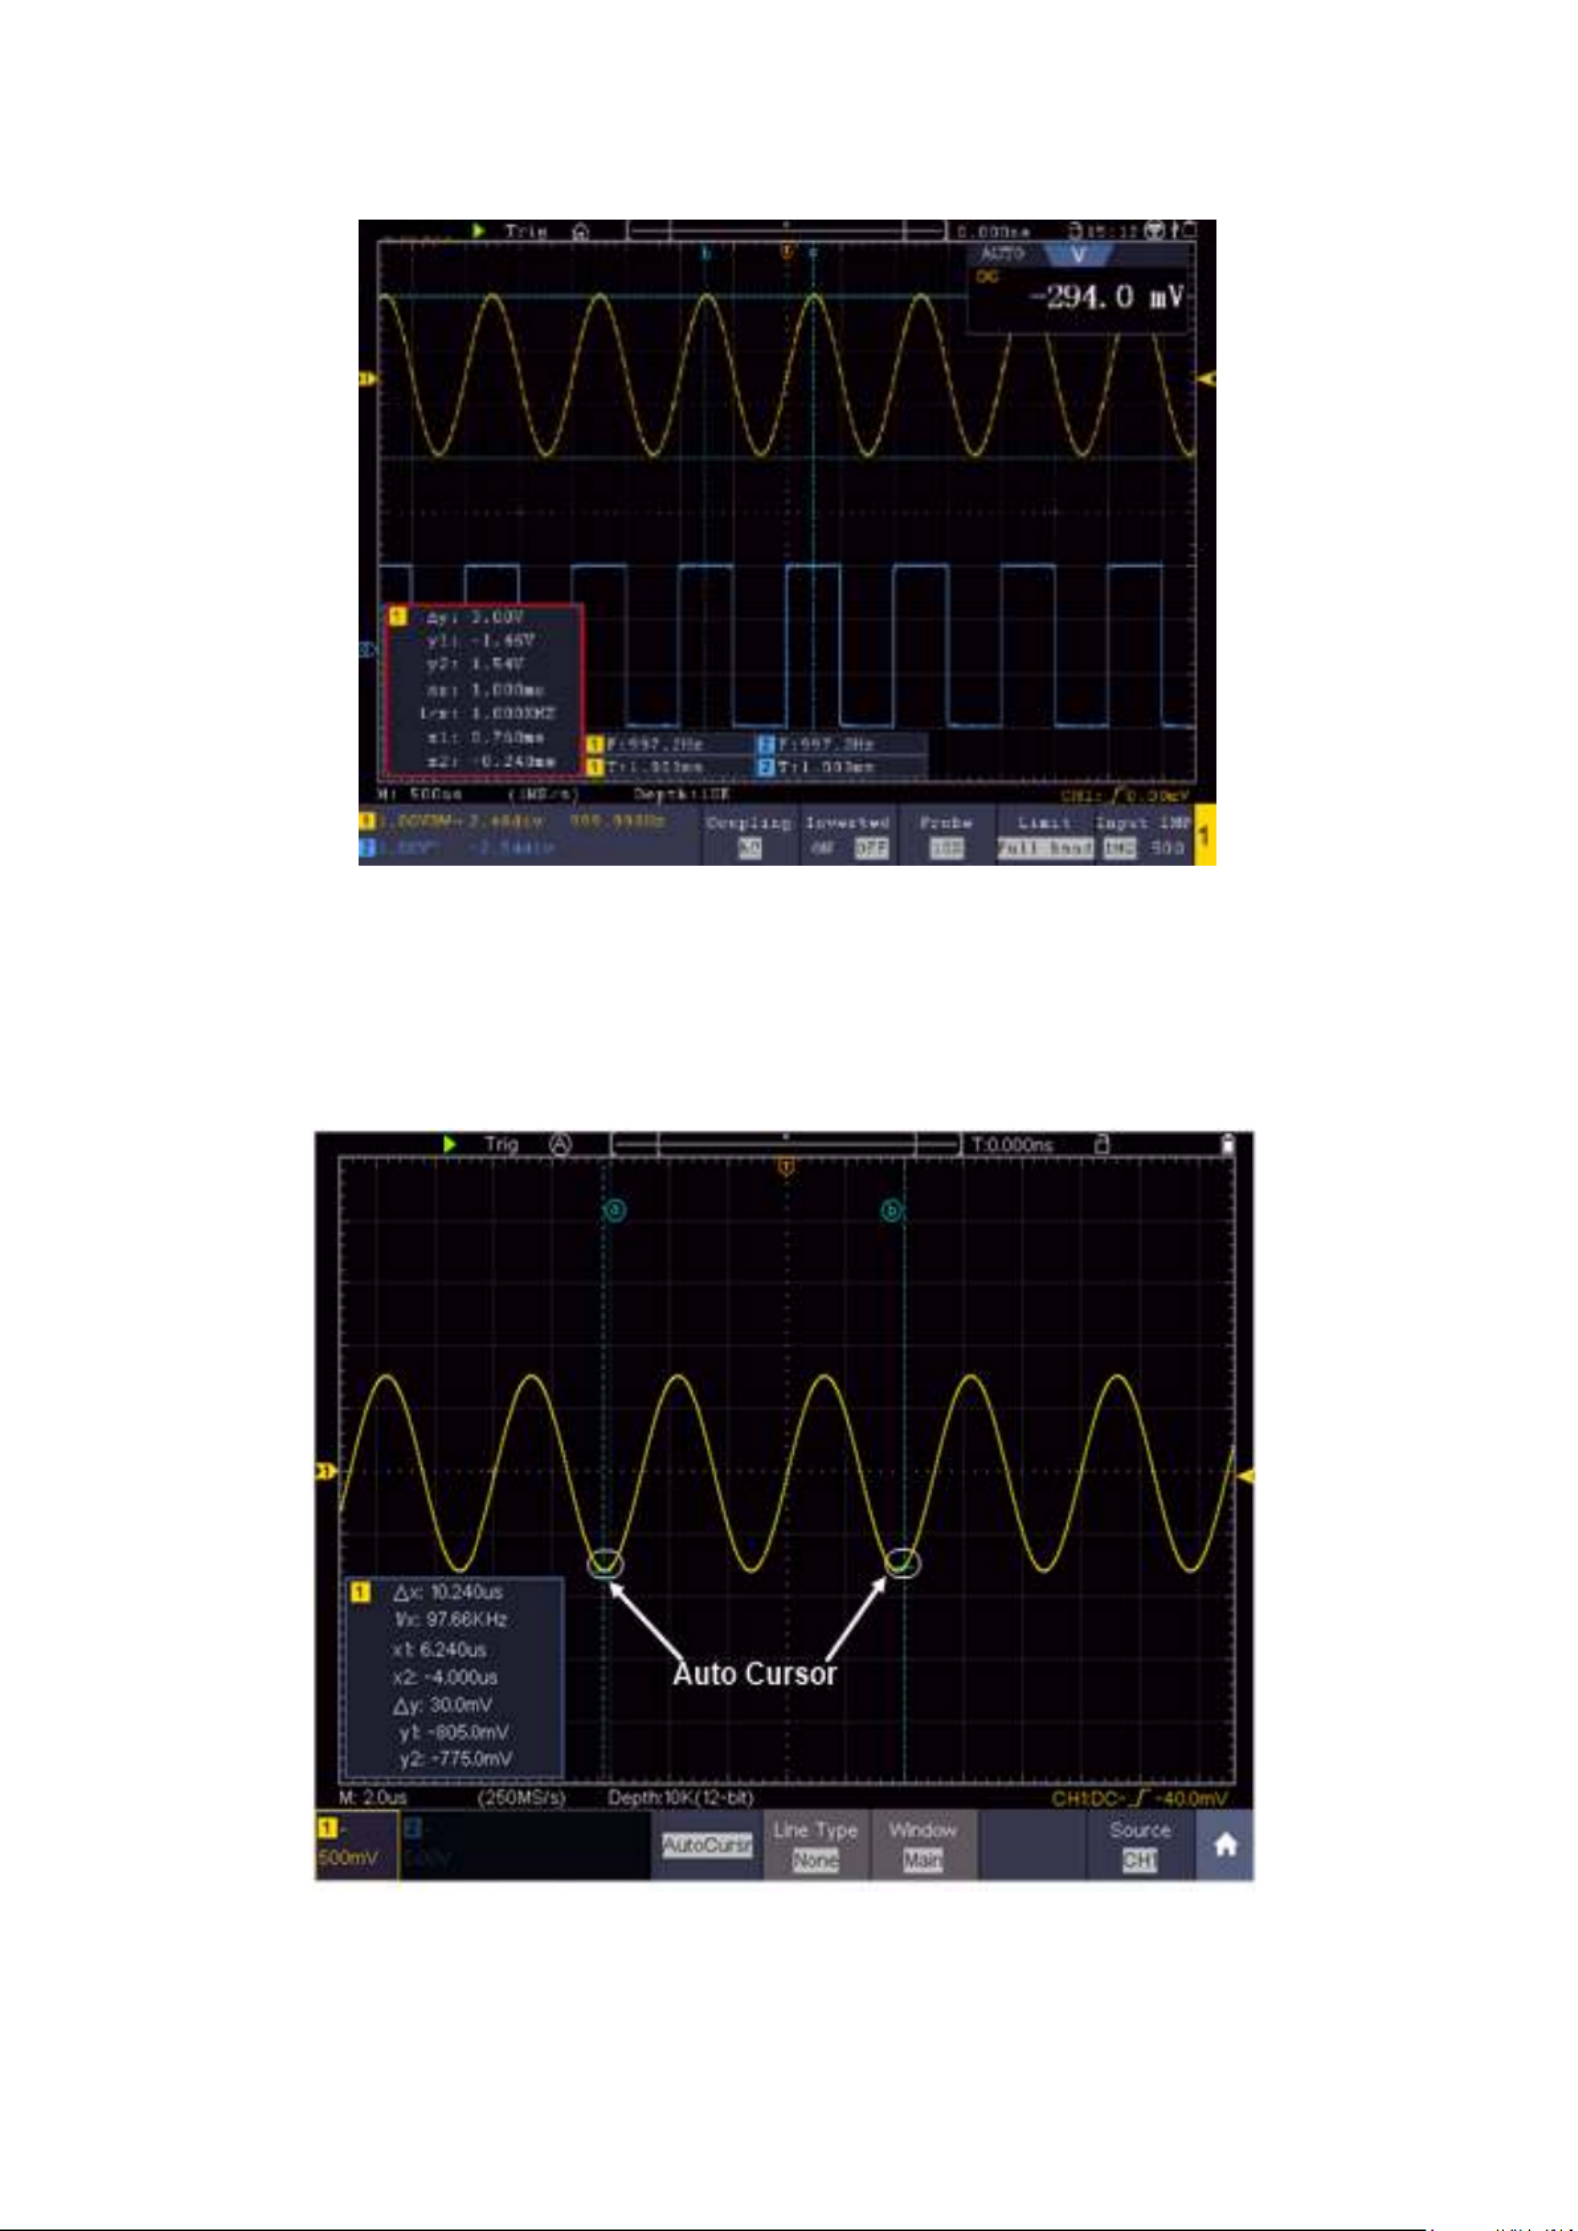
- - 63
6. Push the button to enter wave zoom mode. In the bottom cursor menu, Horizontal HOR
select Window Main Extension as or to make the cursors shown in the main window or
zoom window.
Fig. 4.14 Time & Voltage cursor measurement
Auto Cursor
For the AutoCursor type, the horizontal cursors are set as the intersections of the vertical cursors
and the waveform.
Bild 4.15 Auto Cursor

- - 64
9.2.1 Cursor measurements in FFT mode
In FFT mode, press the cursor button to open the cursor menu.
A description of the cursor menu in FFT mode can be found below:
Menu
Settings
Description
Type
Vamp
Freq
Freq&Vamp
Auto Cursor
Display the Vamp (or Phase) measurement
cursor and menu
Display the Freq measurement cursor and menu
Display the corresponding measurement cursor
and menu
The horizontal cursors are set as the
intersections of the vertical cursors and the
waveform
Line Type
(Freq&Vamp or
Freq&Phase type)
Freq
Vamp
Makes the vertical cursors active
Makes the horizontal cursors active
Window
(Wave zoom mode)
Main
Extension
Measure in the main window
Measure in the FFT extension window
Source
Math FFT
Display the channel to which the cursor
measurement will be applied
Perform the following operation steps for the amplitude and frequency cursor measurement of
math FFT:
1. Click to call up the menu panel. Click the FFT softkey on panel to switch to the ON state
and display the FFT menu. In the bottom menu, select Format. In the right menu, select
amplitude unit ( or V RMS Decibels).
2. Click to call up the menu panel. Click the softkey on panel to switch to the ON Cursor
state and display the cursor menu.
3. In the bottom menu, select as Window Extension.
4. Select the first menu item in the bottom menu, the menu will display at the right of the Type
screen. In the right menu, select Freq&Vamp for Type, two blue dotted lines displayed along
the horizontal direction of the screen, two blue dotted lines displayed along the vertical
direction of the screen. Cursor measure window at the left bottom of the screen shows the
cursor readout.
5. In the bottom menu, select Line Type as Freq to make the vertical cursors active. Click line
a b to select it, swipe left/right to move . Click line it to select it, swipe left/right to move . it
6. In the bottom menu, select Line Type as Vamp to make the horizontal cursors active. Click
line to select it, swipe /down to move . Click line to select it, swipe up/down to move aup it b
it.
7. In the bottom cursor menu, you can select as to make the cursors shown in Window Main
the main window.
9.3 Mathematical manipulation function
The Mathematical Manipulation function is used to show the results of the addition, multiplication,
division and subtraction operations between two channels, advanced math feature including Intg,
Diff, Sqrt, user defined function, and digital filter. Click to call up the menu panel. Click the Ma th
softkey on panel to switch to the ON state and display the math menu on the bottom.
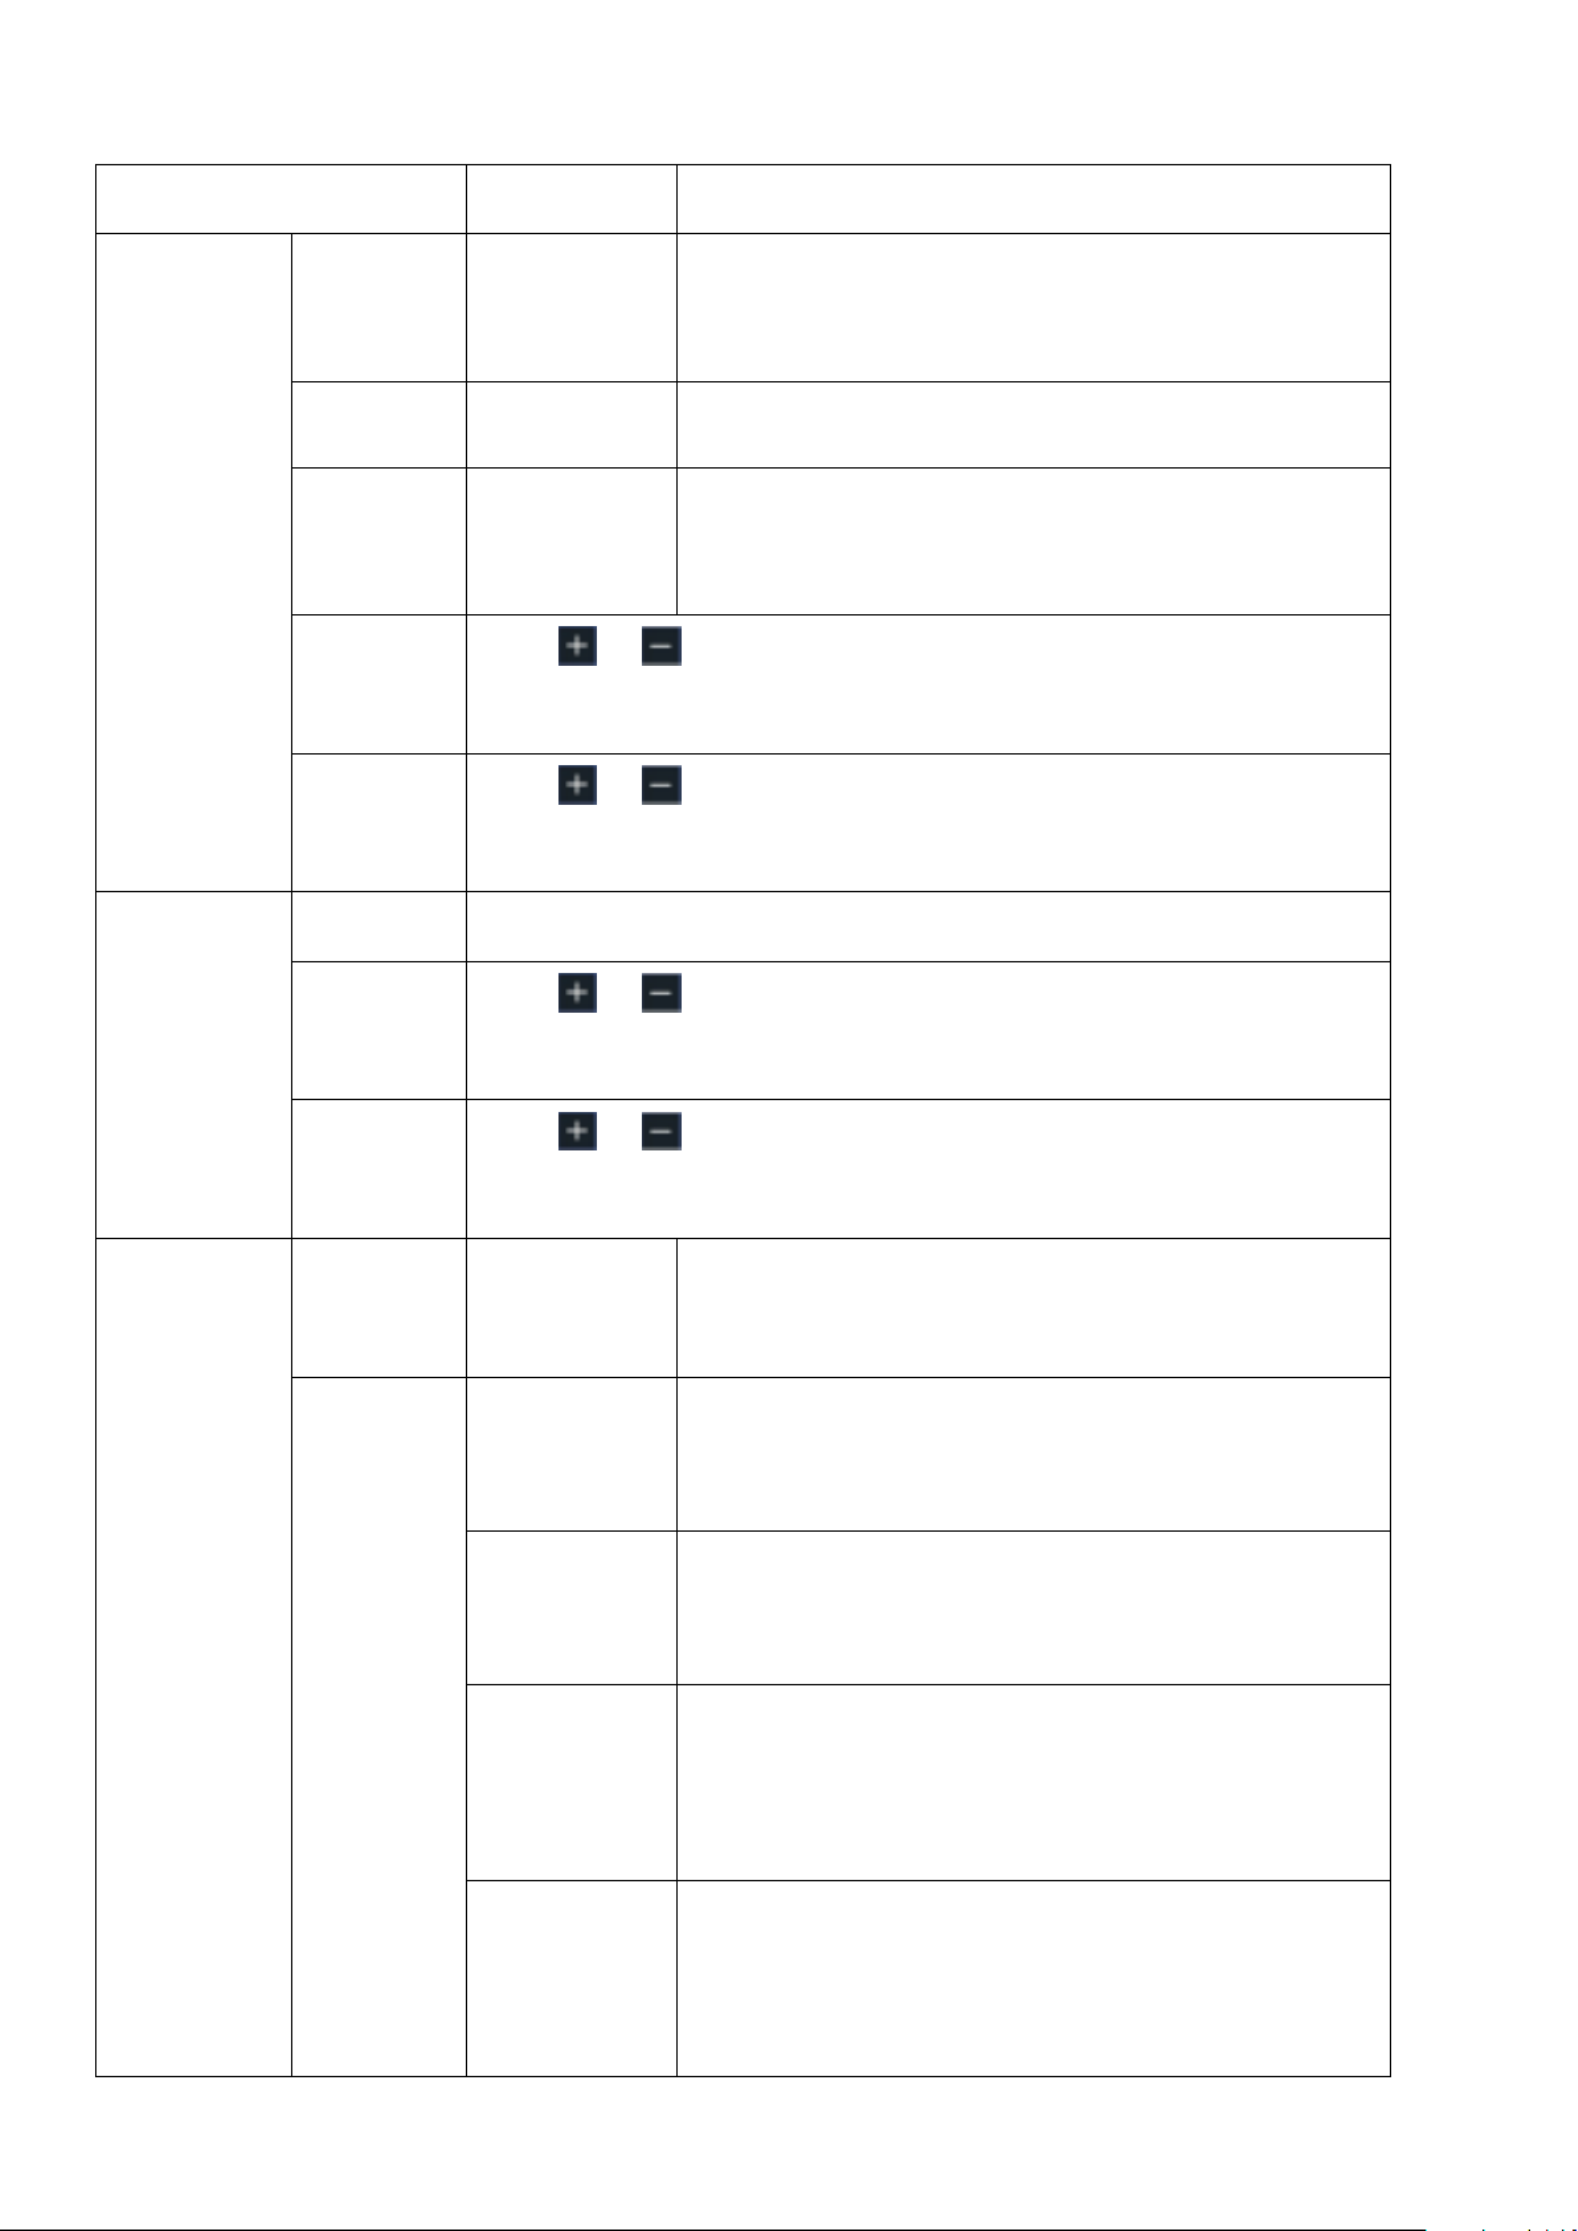
- - 65
The waveform calculation menu:
Menu
Settings
Description
Waveform
Math
Factor1
CH1
CH2
CH3
CH4
Select the signal source of the factor1
Sign
+ - * /
Select the sign of mathematical manipulation
Factor2
CH1
CH2
CH3
CH4
Select the signal source of the factor2
Vertical
(div)
Click or adjust the vertical position of the Math to
waveform
Vertical
(V/div)
Click or adjust the vertical division of the Math to
waveform
User
function
Edit fun
Intg, Diff, Sqrt, and user defined function
Vertical
(div)
Click or adjust the vertical position of the Math to
waveform
Vertical
(V/div)
Click or adjust the vertical division of the Math to
waveform
DIR
Channel
CH1
CH2
Select channnel
Type
low-pass
Only the signals whose frequencies are lower
than the current cut-off frequency can pass the
filter.
high-pass
Only the signals whose frequencies are greater
than the current cutoff frequency can pass the
filter.
band-pass
Only the signals whose frequencies are greater
than the cutoff frequency down and lower than
the current cutoff frequency upper can pass the
filter.
band-reject
Only the signals whose frequencies are lower
than the current cutoff frequency down or
greater than the current cutoff frequency upper
can pass the filter.
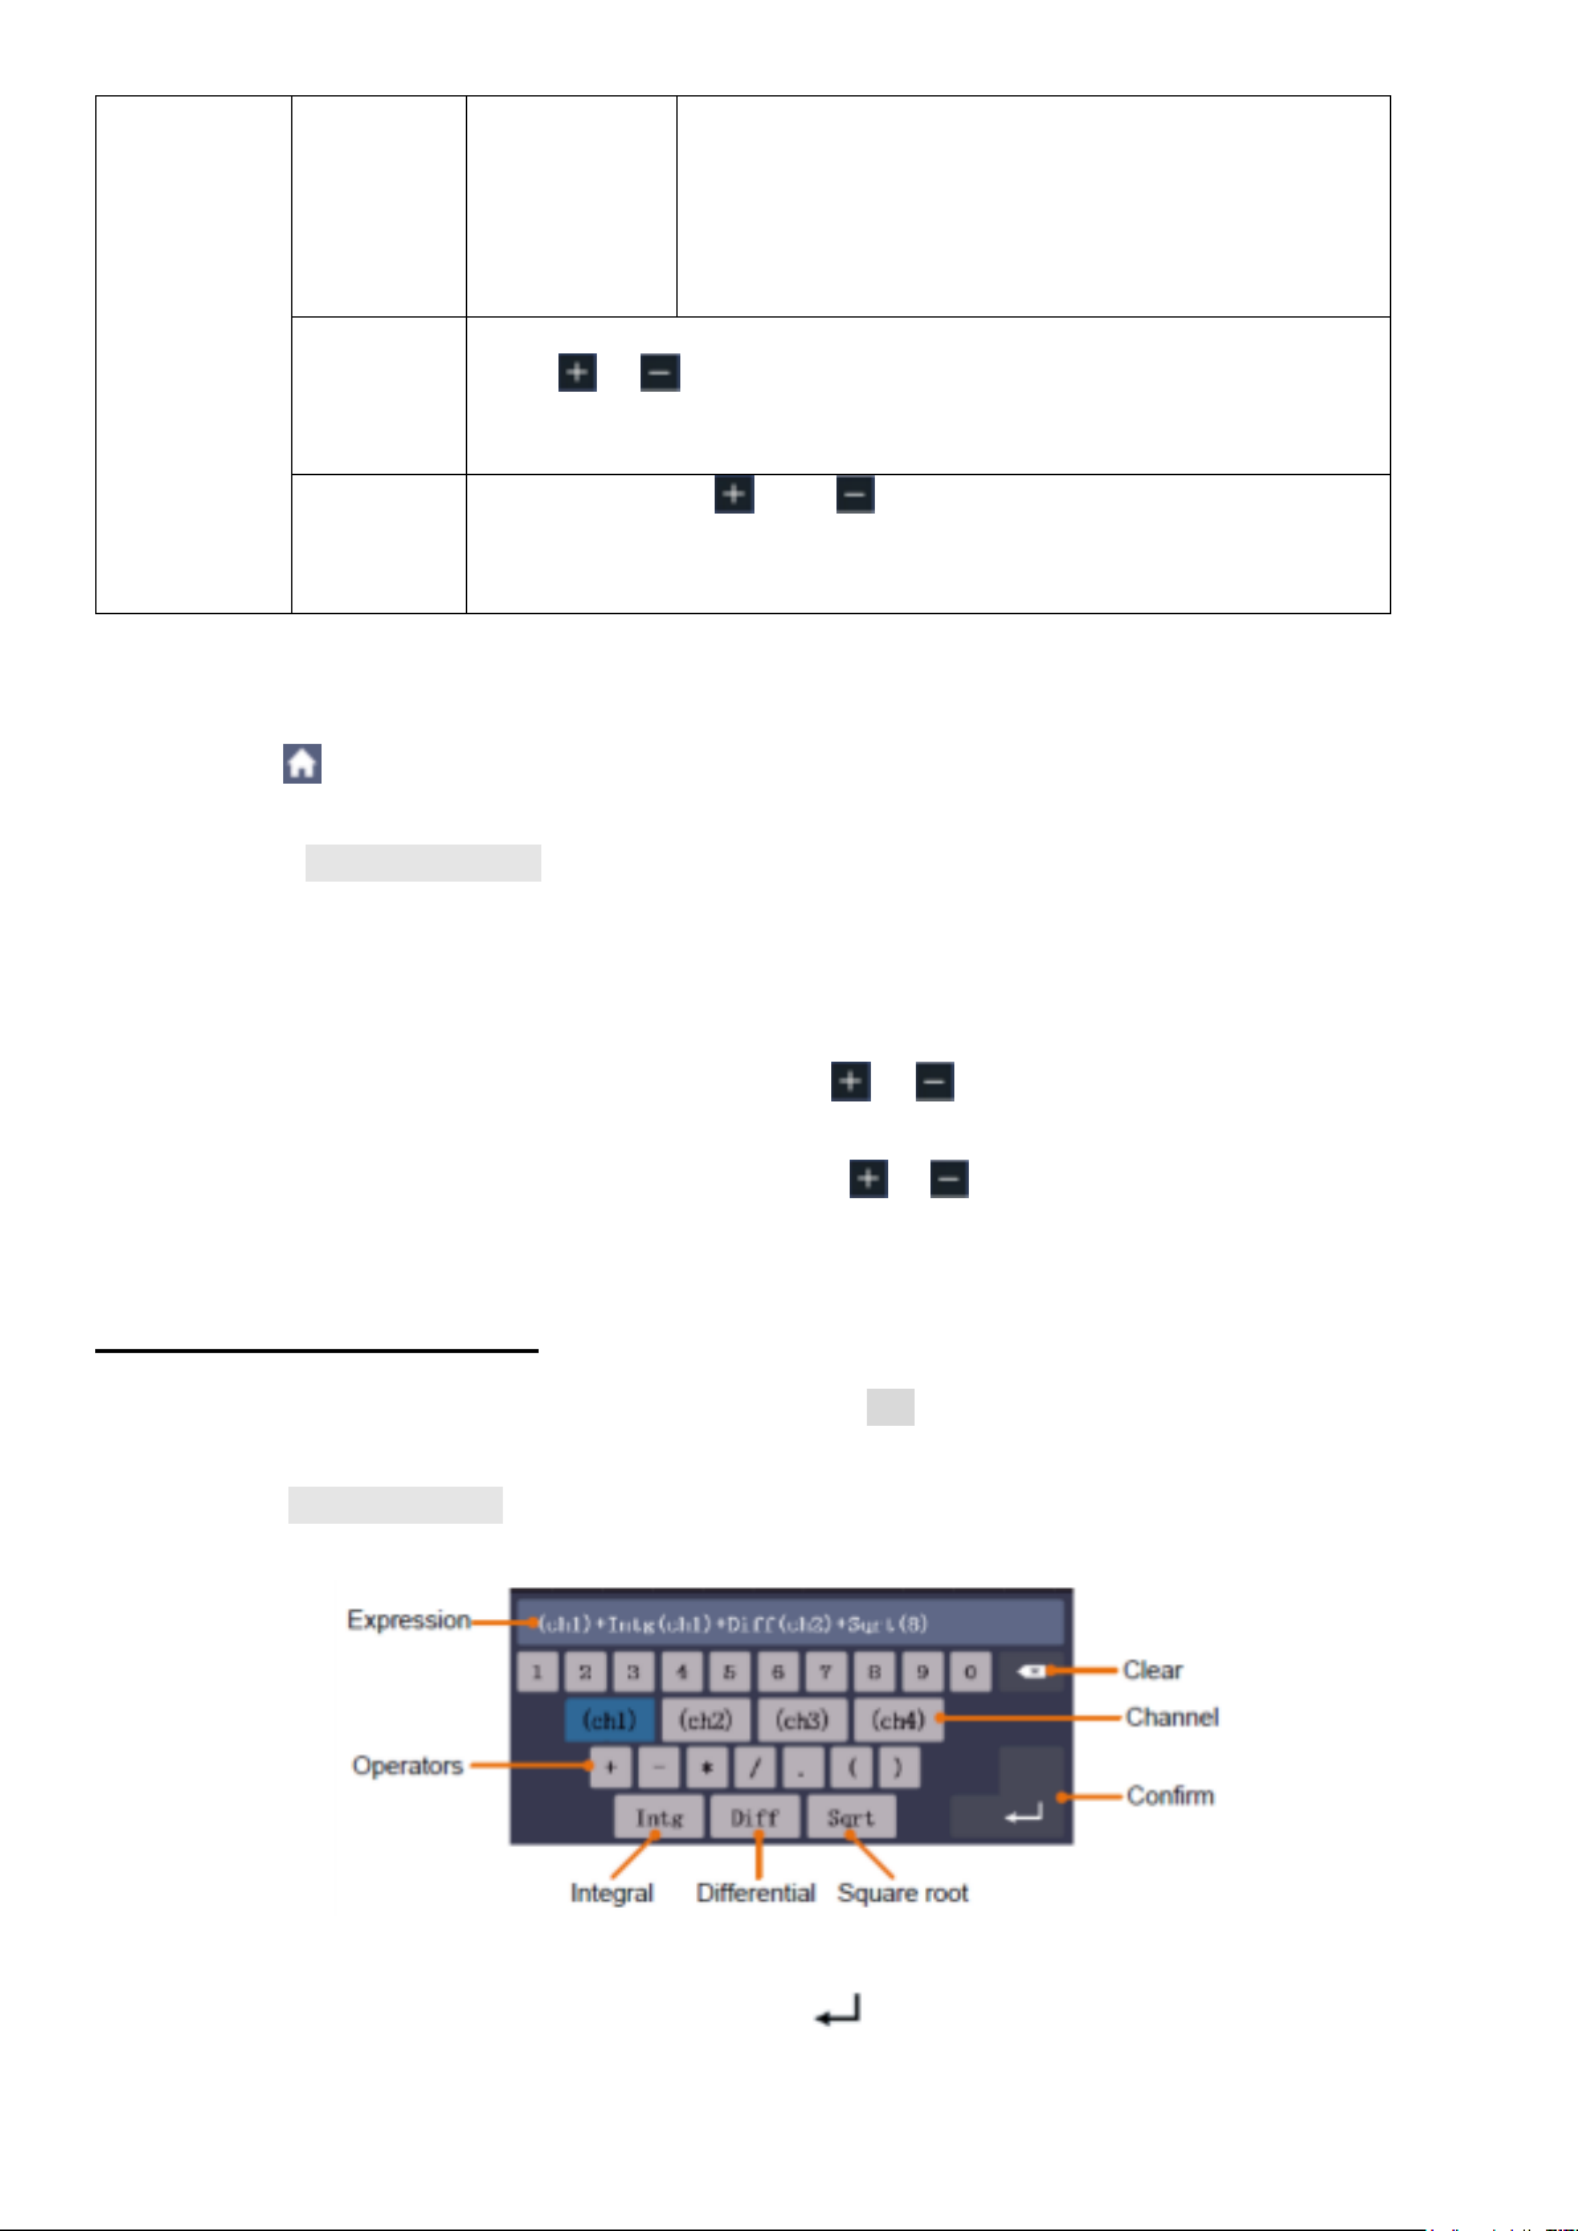
- - 66
Window
Retangular
Tapered
Triangular
Hanning
Hamming
Blackman
Select window for digital filter
cut-off fre
or
upper down
Click or set cut-off frequency to
Vertik al
(div)
Drücken Sie auf , um die vertikale Position der oder
mathematischen Wellenform anzupassen
Example waveforms add CH1 & CH2:
1. Click to call up the menu panel. Click the Math softkey on panel to switch to the ON state
and display the math menu on the bottom. The pink M waveform appears on the screen
2. Select Waveform Math in the bottom menu
3. In the right menu, select as CH1 Factor1
4. Select as in the right menu Sign +
5. as In the right menu, select Factor2 CH2
6. Select in the right menu click or adjust the vertical position of Math Vertical (div) , to
waveform
7. Select Vertical (V/div) in the right menu, click or to adjust the vertical division of Math
waveform
9.4 User defined function
1. Click the softkey on panel to switch to the state and display the math menu on the Math ON
bottom
2. Select in the bottom menu, select in the right menu, User Function Edit fun an expression
input keyboard pops up
Figure 4.16 Keyboard
3. Create an expression. When done, choose in the keyboard to confirm. The division of
Math waveform is displayed at the left bottom of screen
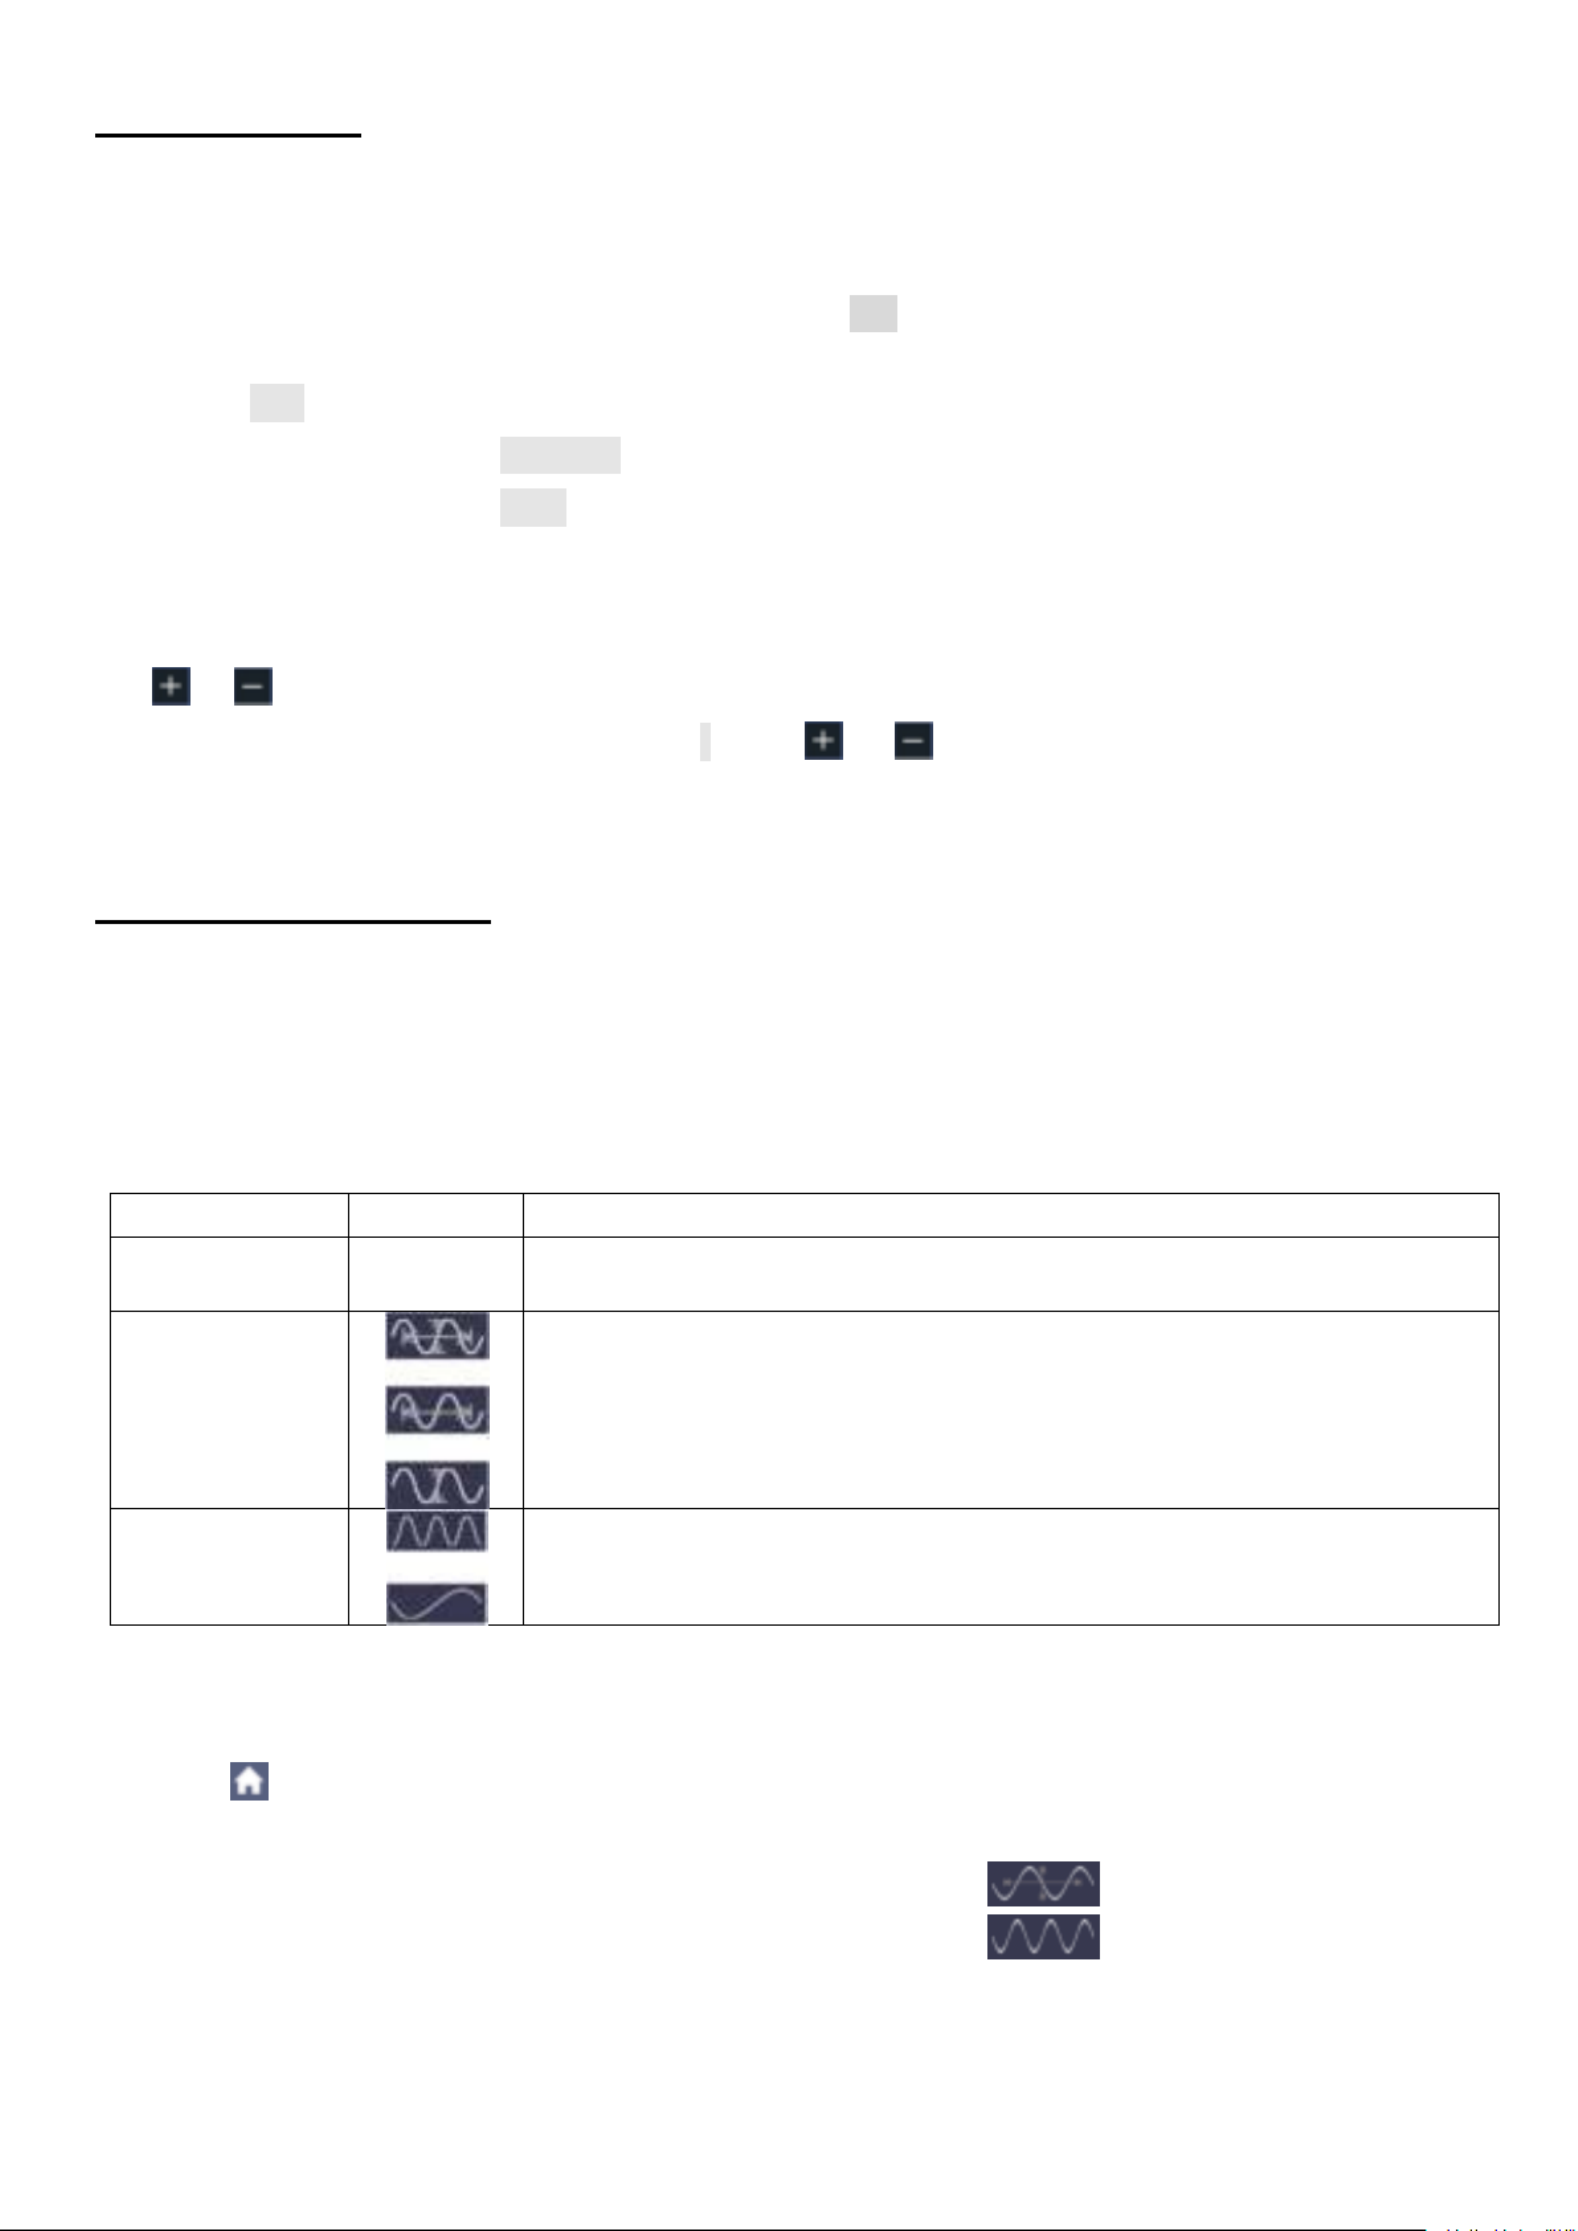
- - 67
9.5 Digital filter
Digital filter provides 4 types of filters (low pass, high pass, band pass and band reject). The
specified frequencies can be filtered by setting the cut-off frequency. Digital filters can only be
used for CH1 or CH2.
1. Click the softkey on panel to switch to the state and display the math menu on the Math ON
bottom
2. Select in the bottom menu DIR
3. In the right menu, select as or channel CH1 CH2
4. In the right menu, select select the desired filter type type,
5. In the right menu, select , select the desired window window
6. When or type is selected, select low-pass high-pass cut-off fre in the right menu.
When band-pass or band-reject type is selected, select upper or down in the right menu. Click
or adjust the frequency to
7. In the right menu, select click or adjust the vertical position of Math Vertical (div), to
waveform. The voltage division of Math waveform is the same as the selected channel
9.6 Autoscale function
This is a function which is used to carry out a simple and quick test on the input signal. The
function is applied to follow-up signals automatically even if the signals change at any time.
Autoscale enables the instrument to set up trigger mode, voltage division and time scale
automatically according to the type, amplitude and frequency of the signals.
Press Autoscale to display the following menu:
Menu
Settings
Description
AutoScale
ON
OFF
Switching on the autoscale function
Switching off the autoscale function
Mode
Follow-up and adjust both vertical and horizontal settings.
Follow-up and only adjust horizontal scale.
Follow-up and only adjust vertical scale.
Wafevorm
Show multi period waveforms
Shows only one or two periods
To measure the signal using autoscale, you can do as the follows:
1. Click to call up the menu panel. Click the softkey on panel to switch to the ON Autoscale
state. The function menu will appear.
2. In the bottom menu, Select . In the right menu, select Mode .
3. In the bottom menu, Select . In the right menu, select Wave .
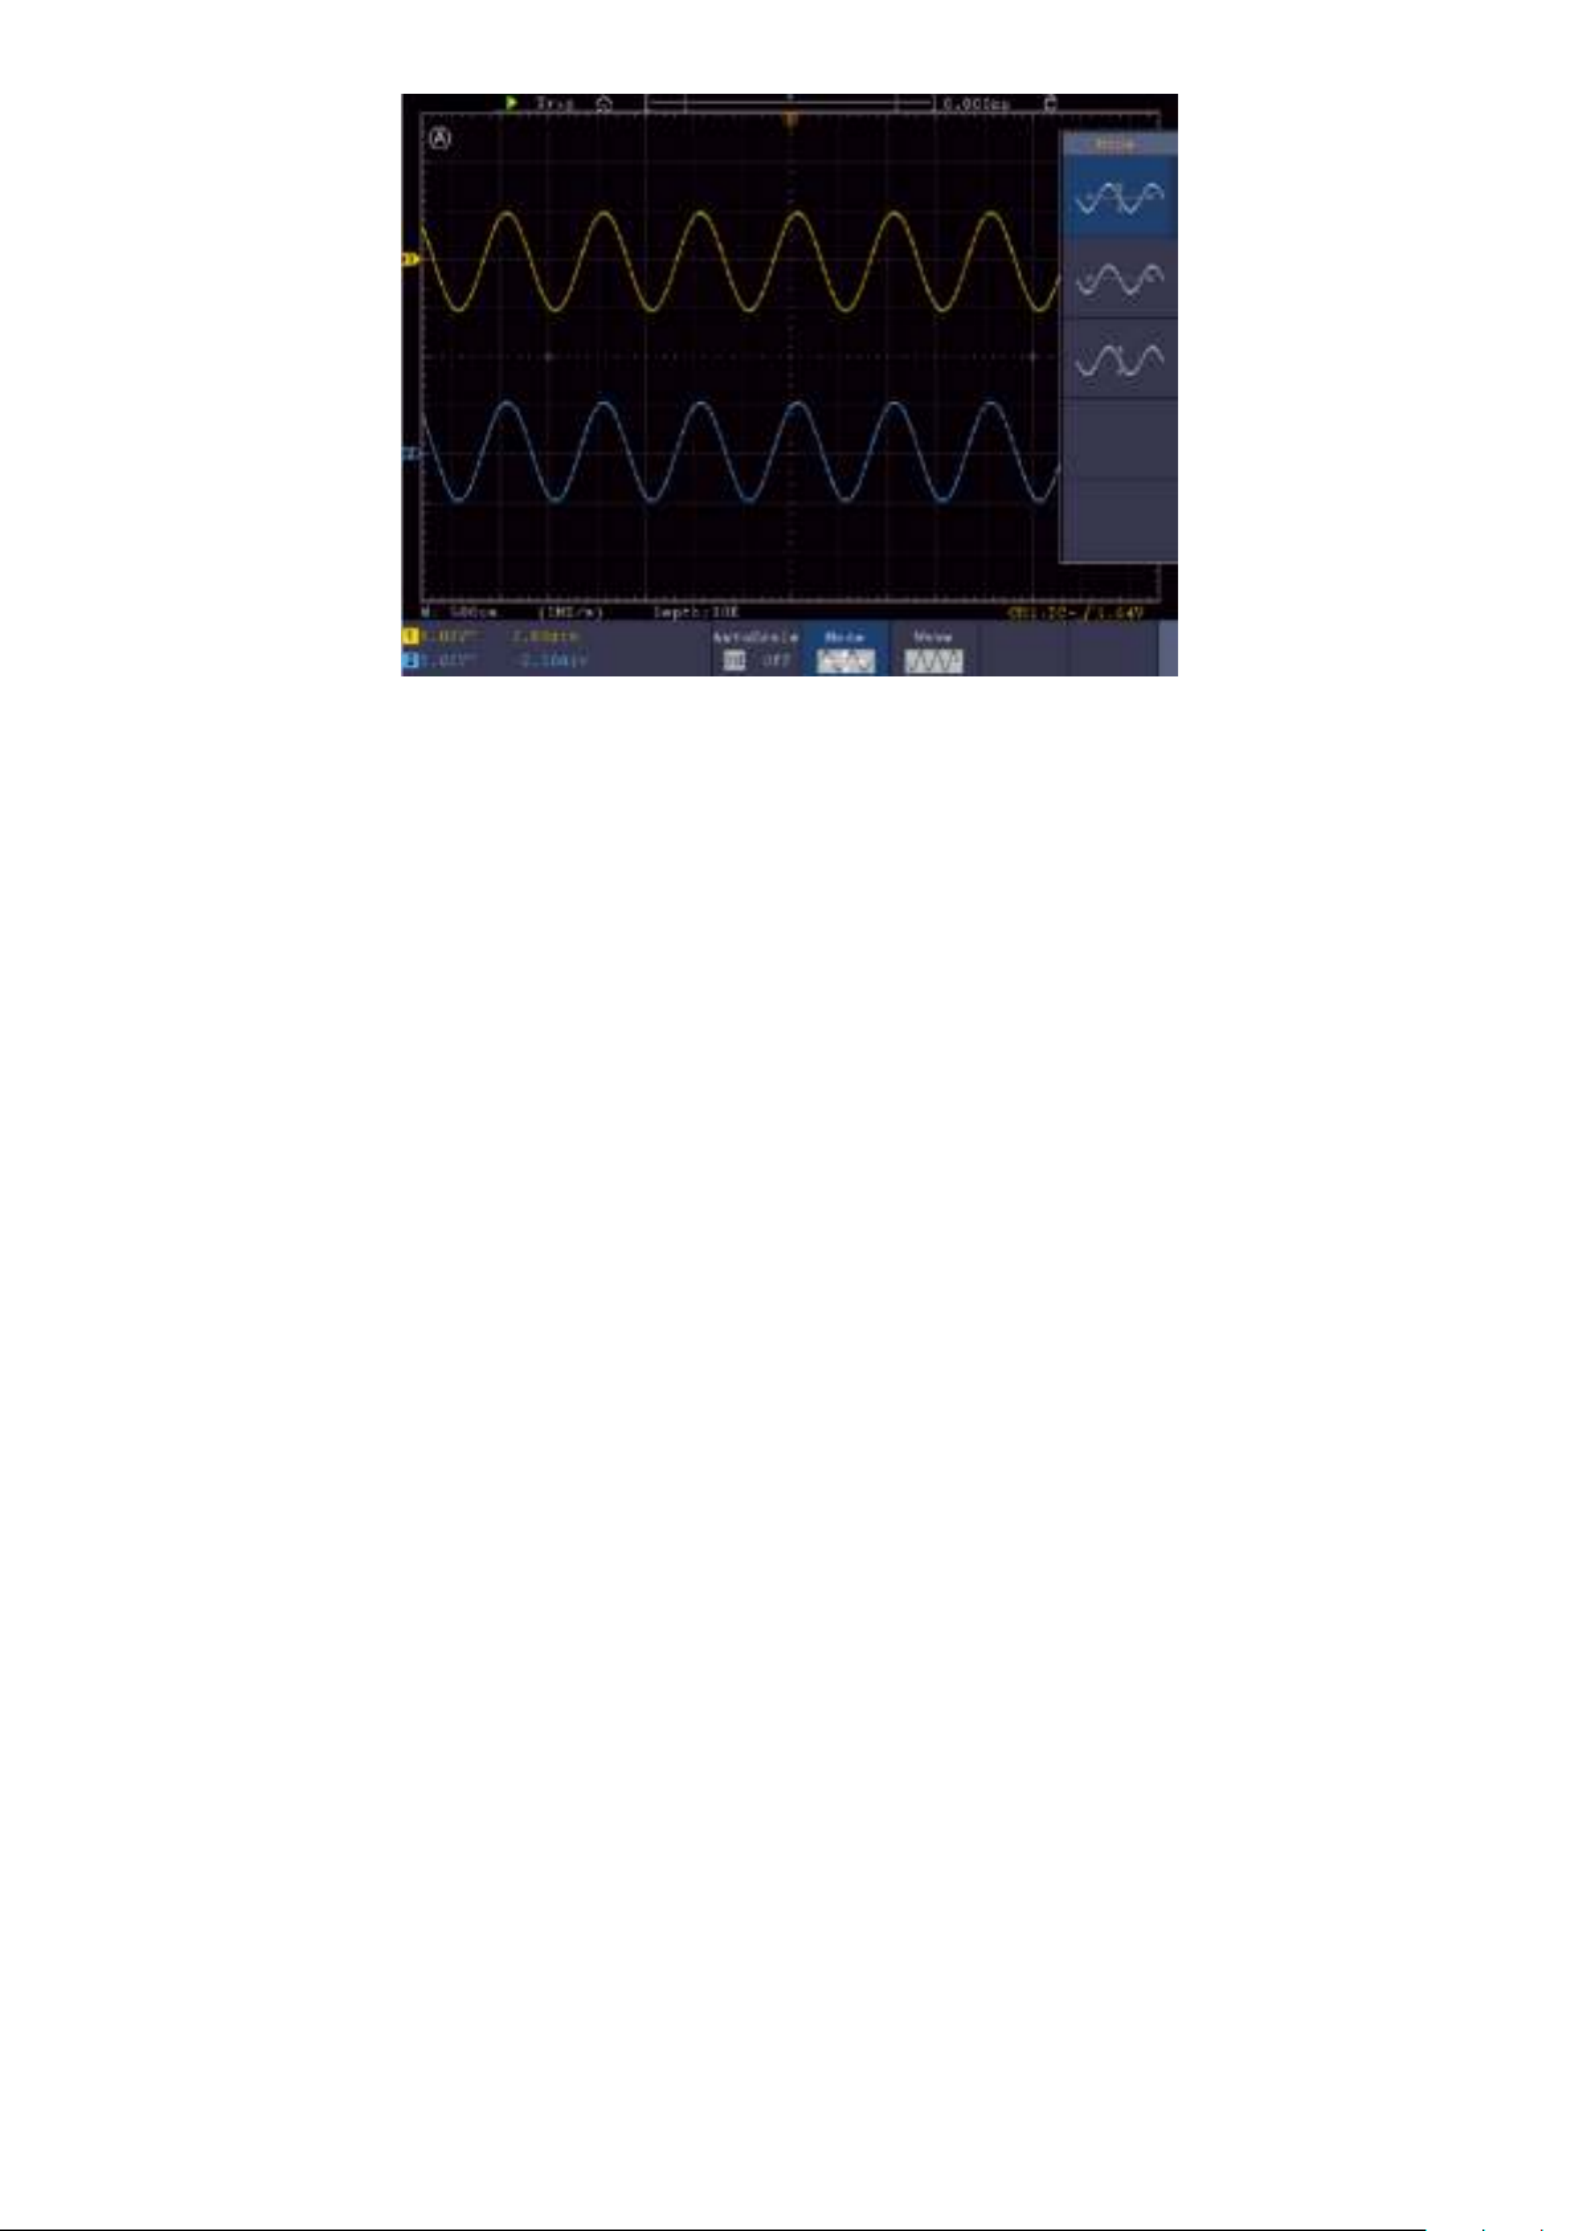
- - 68
Figure 4.17 Autoscale function
1. When entering into Autoscale function, a autoscale indicator will be flickering on the top left of
the screen.
2. In the mode of Autoscale, the oscilloscope can self-estimate Trigger Mode (Edge, Video). At this
point, the trigger menu is not available.
3. When the input signal contains the DC component, the coupling will be set to AC, the amplitude
of the input signal should be greater than 5mV, and the frequency should be greater than 20Hz.
4. At the mode of Autoscale, DSO is always set as DC coupling with AUTO triggering, the holdoff
is set to 100ns.
5. At the mode of Autoscale, if adjust the vertical position, voltage division, trigger level or time
scale, the oscilloscope will pause the Autoscale function. To resume Autoscale, push the
Autoset front panel button.
6. When video triggering, the horizontal time scale is 50us.
7. While the Autoscale is working, the settings below will be made forcibly:
The DSO will switch from the wave zoom mode to the normal mode In the decoding, pass/fail .
or XY mode, when entering into Autoscale, these modes will be turned off. In the STOP status,
when entering into Autoscale, the status will be set to RUN.
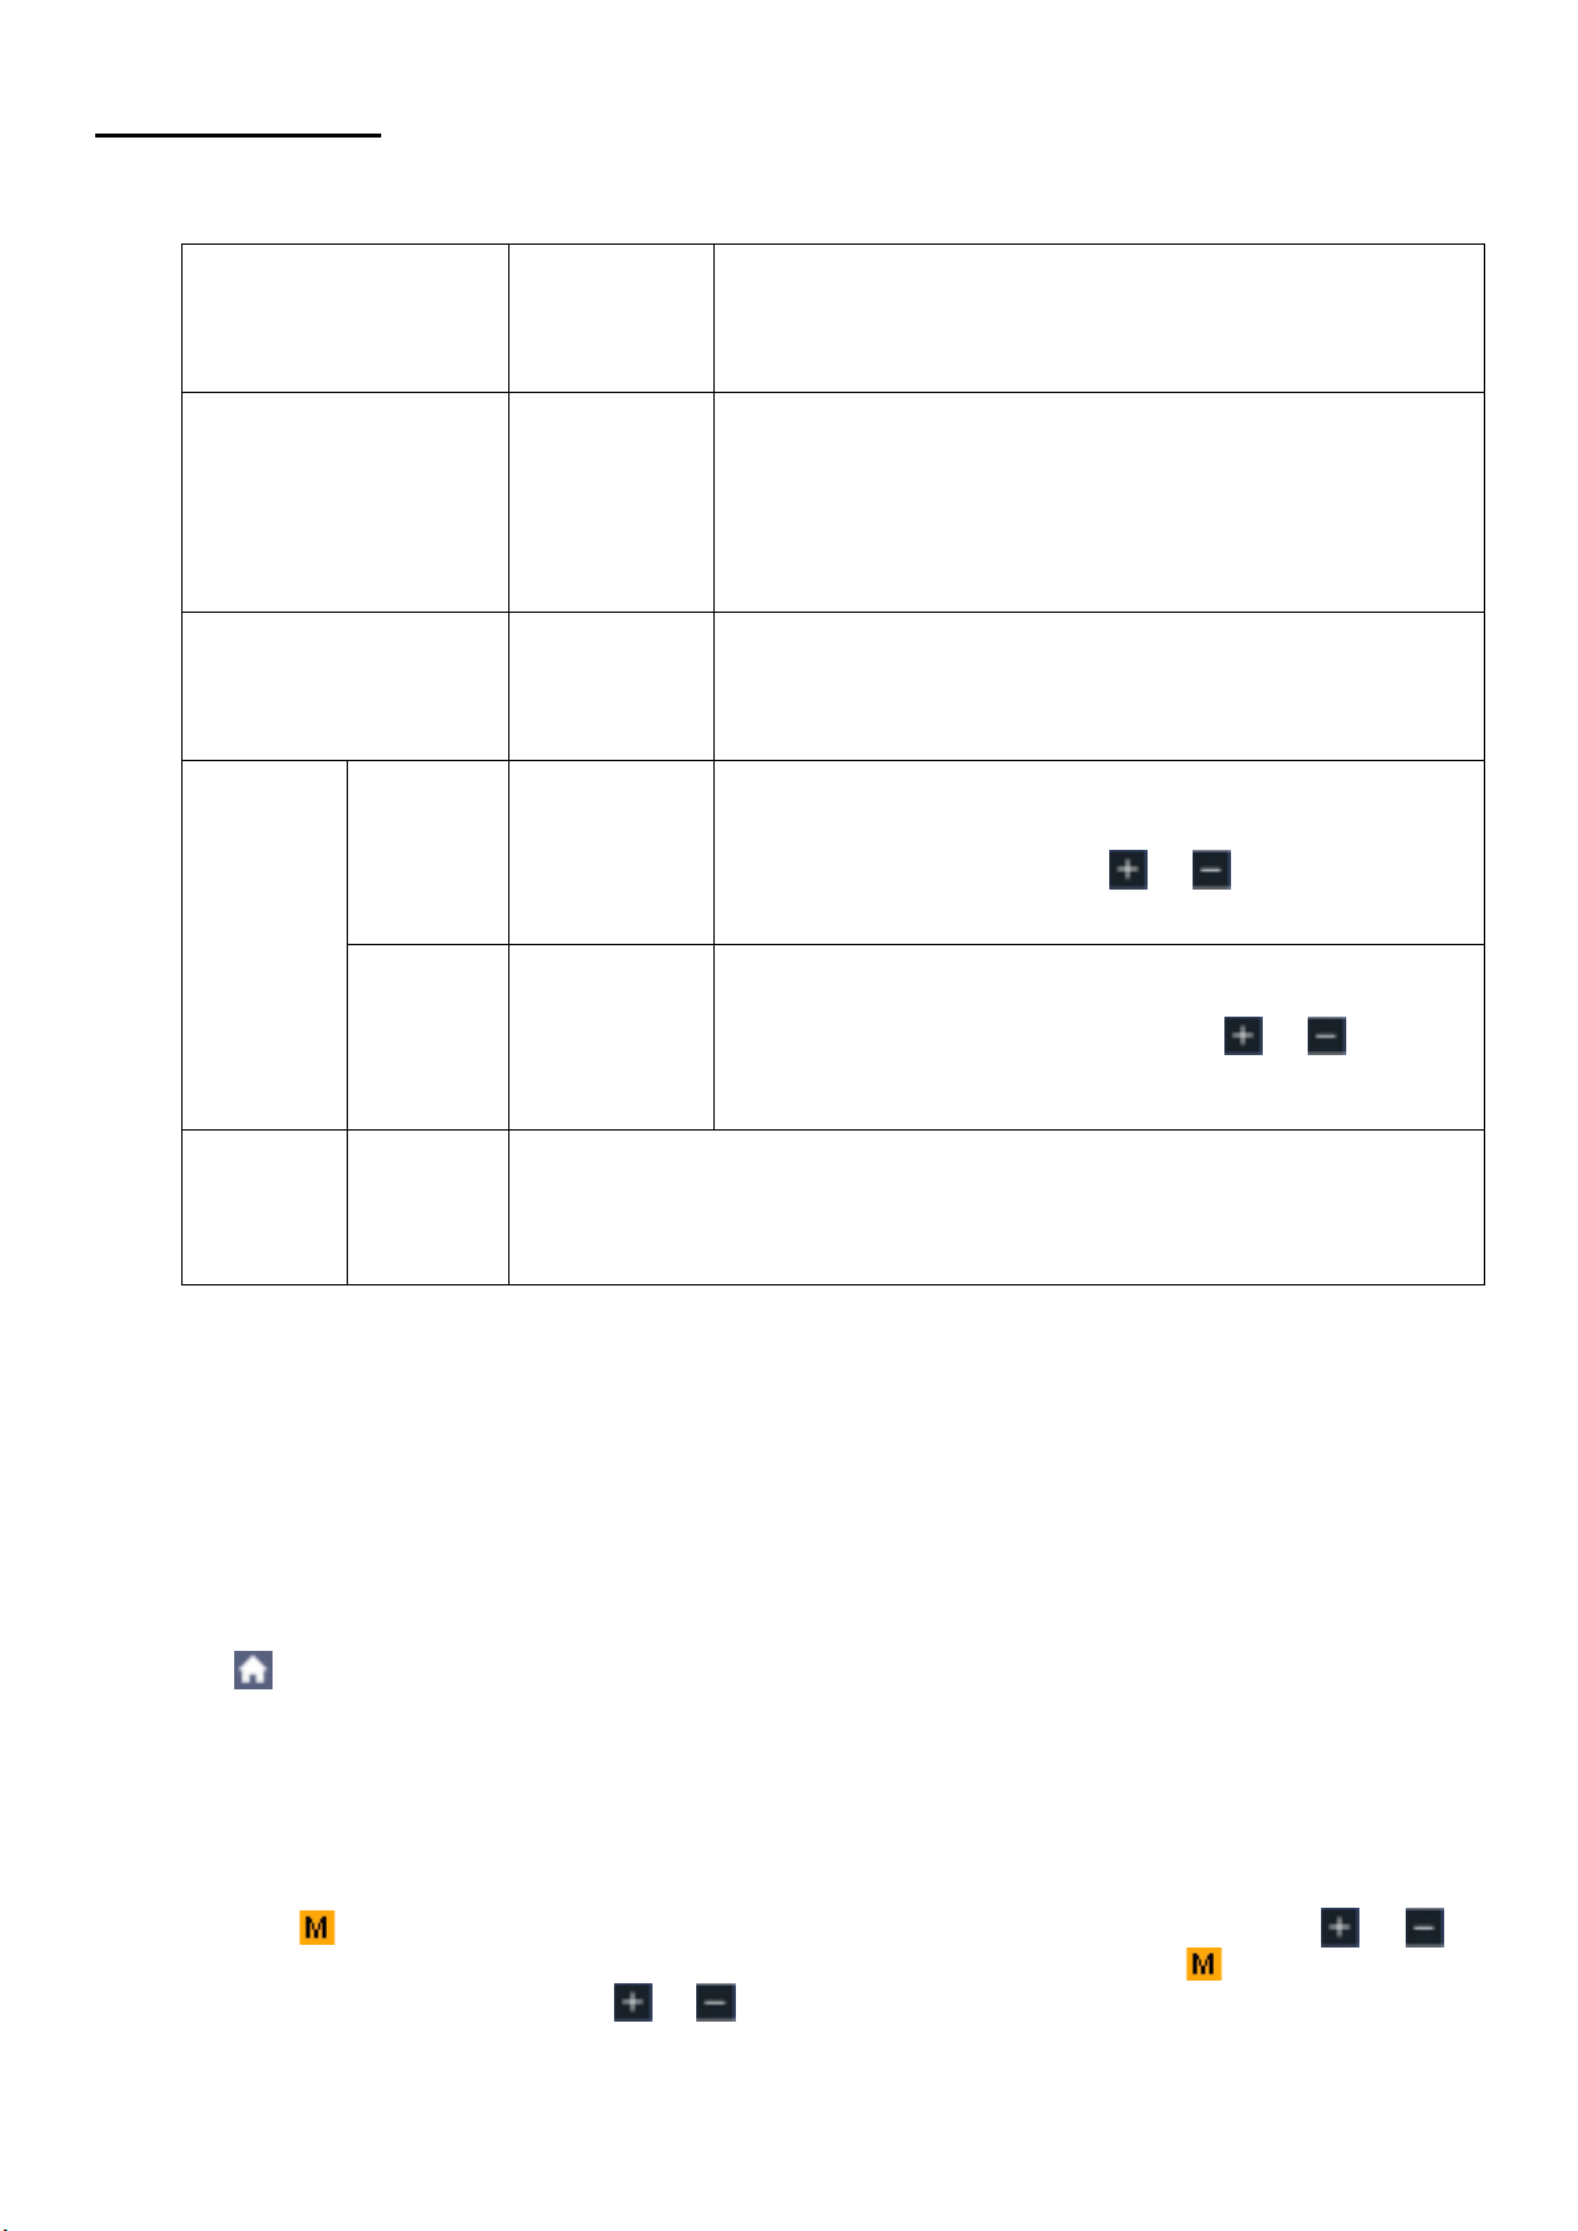
- - 69
9.7 FFT function
FFT refers to the Fourier transform operation on a certain channel.
The FFT menu:
Source
CH1
CH2
CH3
CH4
Select the FFT source.
Window
Rectangle
Hanning
Hamming
Blackman
Bartlett
Kaiser
Select window for FFT.
Format
Vrms
dB
Radian
Degrees
V RMS and Decibels are amplitude units; Radian,
Degrees are phase units
Display
Hori
Position
value
Time base
value/
Switch to select the horizontal position or time base
of the FFT waveform, click or to adjust it.
Vertical
Position
value
Division
value/
Switch to select the vertical position or voltage
division of the FFT waveform, click or to
adjust it.
FFT
Peak
ON
OFF
Enable or disable FFT peak search. Dynamic marker marks the ▽
FFT peak.
The FFT (fast Fourier transform) math function mathematically converts a time-domain waveform
into its frequency components. It is very useful for analyzing the input signal on Oscilloscope. You
can match these frequencies with known system frequencies, such as system clocks, oscillators,
or power supplies.
FFT function in this oscilloscope transforms 8192 data points of the time-domain signal into its
frequency components mathematically (the record length should be 10K or above). The final
frequency contains 4096 points ranging from 0Hz to Nyquist frequency.
Example for the FFT function operation:
1. Click to call up the menu panel. Click the FFT softkey on panel to switch to the ON state and
display the FFT menu on the bottom. The pink M waveform appears on the screen.
2. In the bottom menu, select . In the right menu, select CH1. Source
3. In the bottom menu, select . In the right menu, select the proper window type. Window
4. In the bottom menu, select . In the right menu, select amplitude unit (V RMS, Decibels) Format
or phase unit (Radian, Degrees).
5. In the bottom menu, select Display. In the right menu, select Hori (Hz); select repeatedly to
make the the horizontal position value (the upper one) click or symbol in front of , to
adjust the horizontal position of FFT waveform; then select to make the symbol in front of
the time base value below, click or to adjust the time base of FFT waveform.
6. Select the right menu; do the same operations as above to set the vertical position Vertical in
and vertical division.
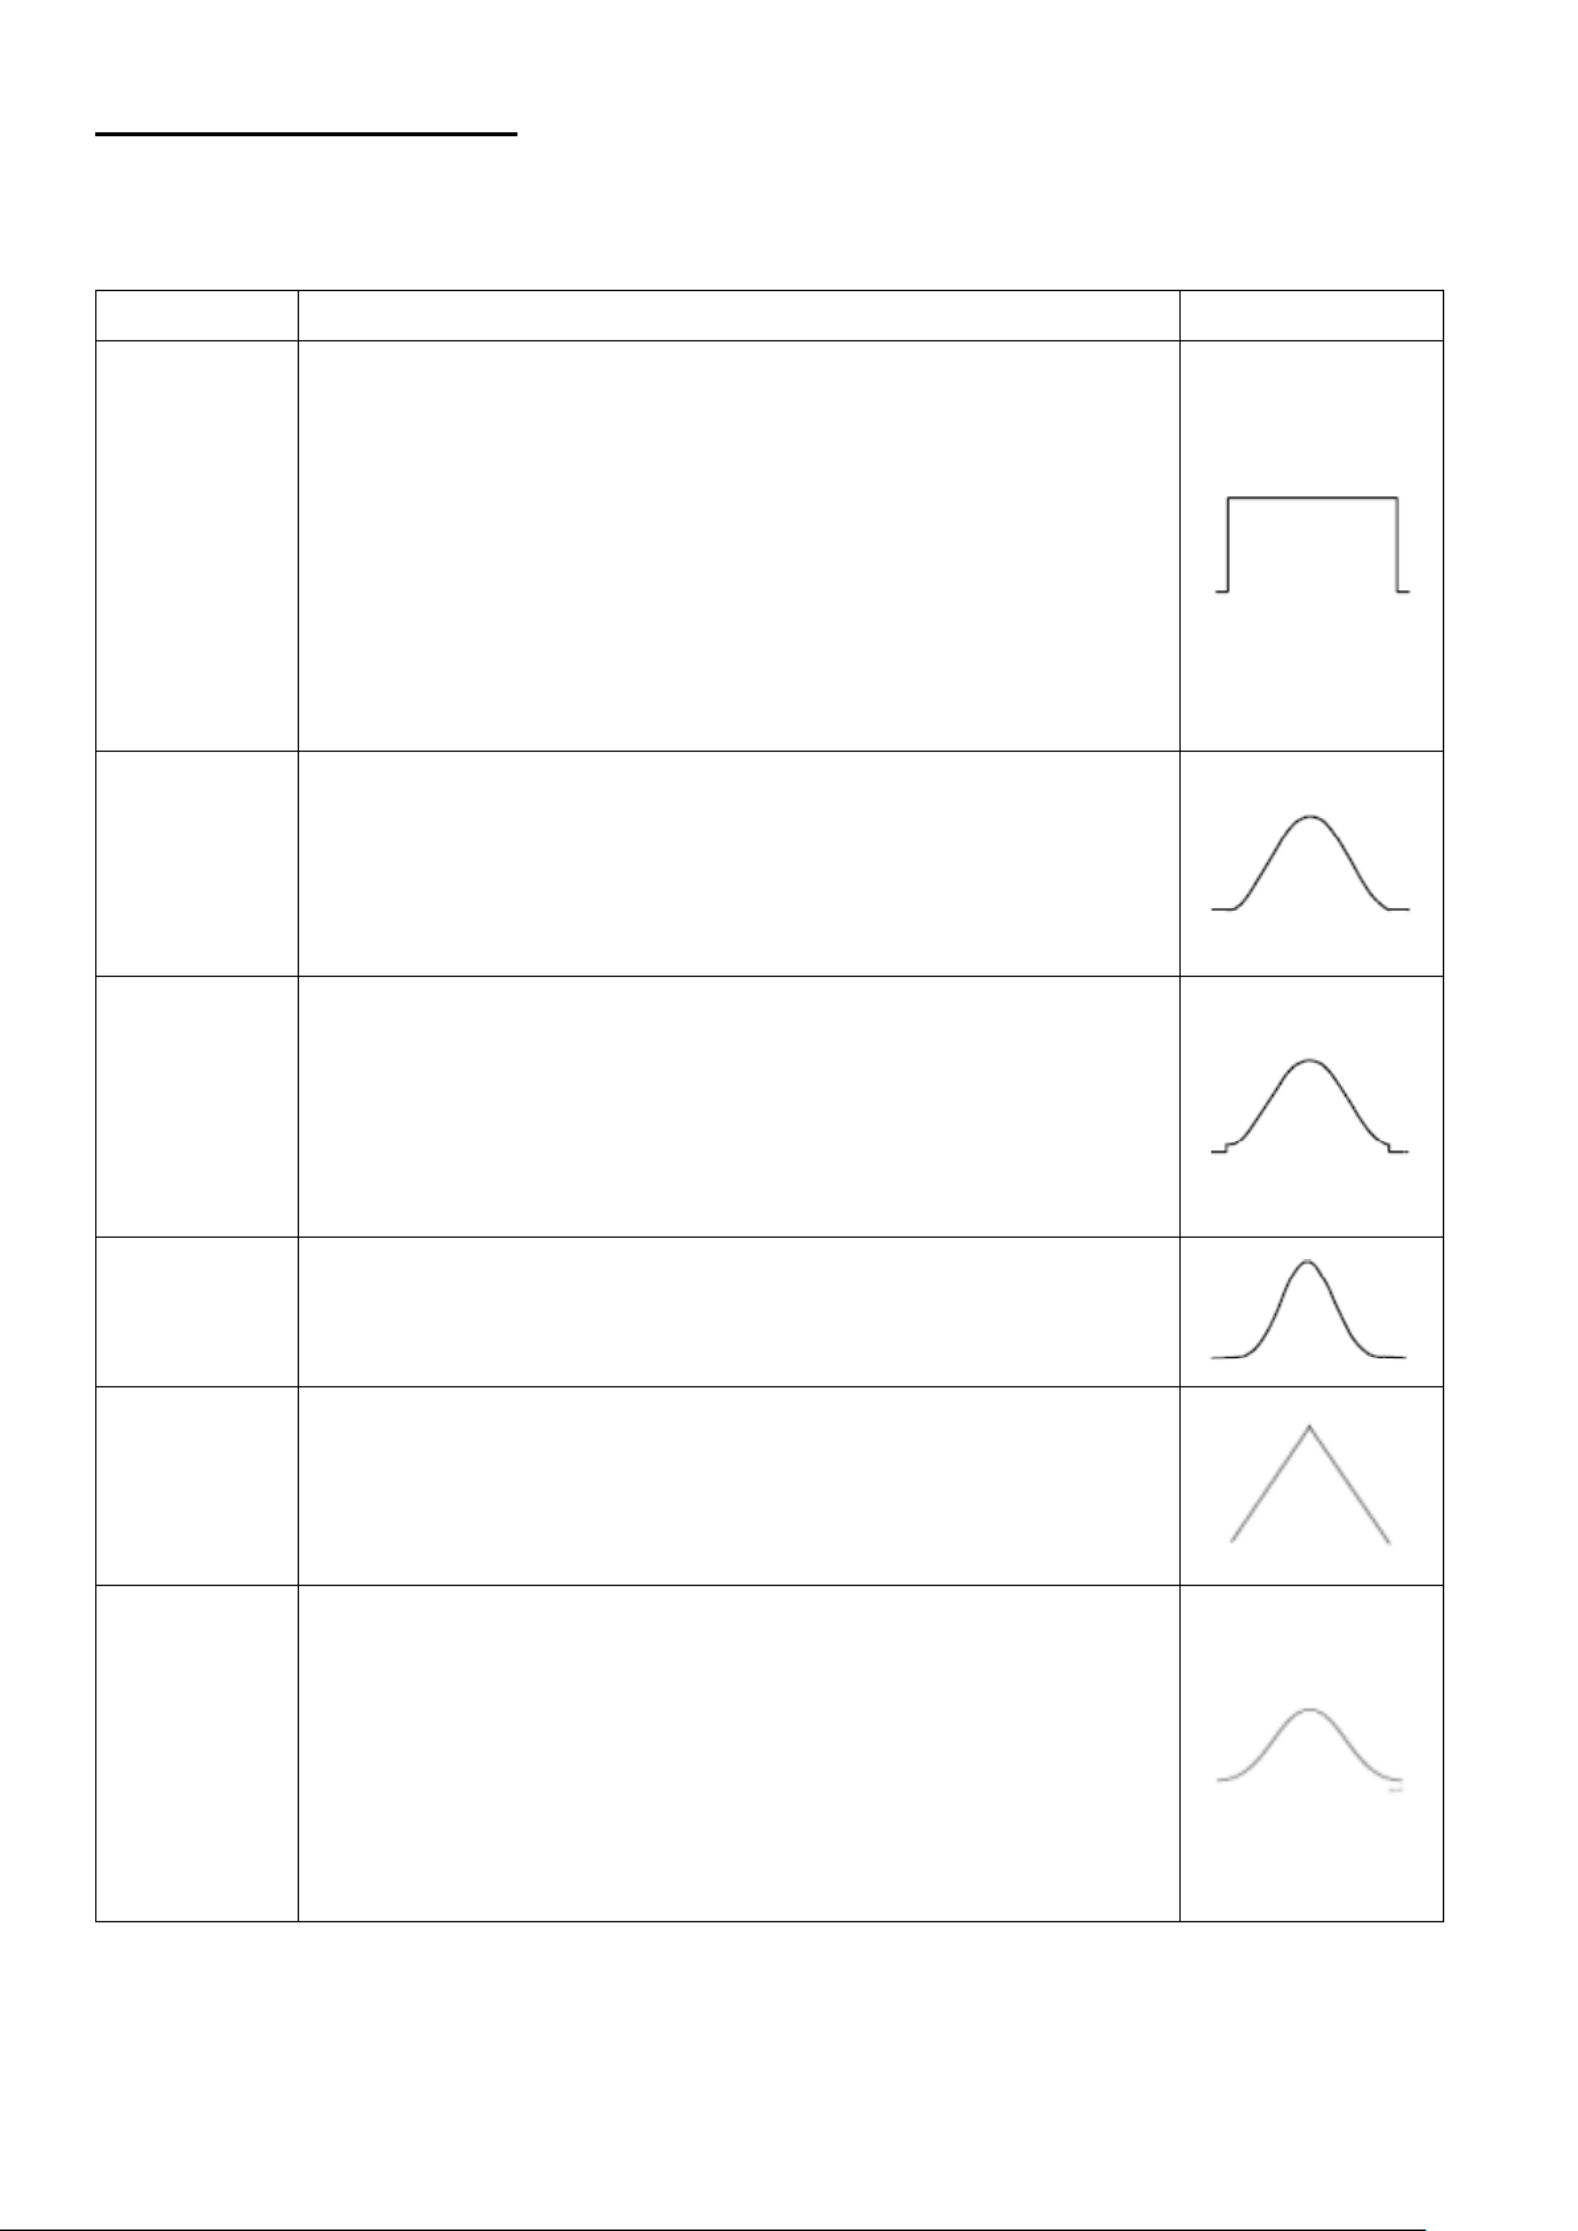
- - 70
9.7.1 Select the FFT window
There are 6 FFT windows. Each one has trade-offs between frequency resolution and magnitude
accuracy. What you want to measure and your source signal characteristics help you to determine
which window to use. Use the following guidelines to select the best windo w:
Type
Characteristics
Window
Rectangle
Best solution for frequency, worst for magnitude.
Best type for measuring the frequency spectrum of
nonrepetitive signals and measuring frequency components
near DC.
Recommend to use for:
Transients or bursts, the signal level before and after the
event are nearly equal
Equal-amplitude sine waves with frequencies those are
very close
Broadband random noise with a relatively slow varying
spectr um
Hanning
Good for magnitude, but poorer frequency resolution than
Hamming.
Recommend to use for:
Sine, periodic and narrow band random noise
Transients or bursts where the signal levels before and
after the event are significantly different
Hamming
Better solution for magnitude than Rectangle, and good for
frequency as well. It has slightly better frequency resolution
than Hanning.
Recommend to use for:
Sine, periodic and narrow band random noise
Transients or bursts where the signal levels before and
after the event are significantly different
Blackman
Best solution for magnitude, worst for frequency.
Recommend to use for:
Single frequency waveforms, to find higher order
harmonics
Bartlett
The Bartlett window is a slightly narrower variant of the
triangular window, with zero weight at both ends.
Kaiser
The frequency resolution when using the Kaiser window is
fair; the spectral leakage and amplitude accuracy are both
good.
The Kaiser window is best used when frequencies are very
close to the same value but have widely differing amplitudes
(the side lobe level and shape factor are closest to the
traditional Gaussian RBW). This window is also good for
random signals.

- - 71
Notes for using FFT
Use the default scale for details of multiple frequencies, even if they have very different dB
amplitudes. Use the scale to compare frequencies. Vrms
DC component or offset can cause incorrect magnitude values of FFT waveform. To minimize
the DC component, choose AC Coupling on the source signal.
To reduce random noise and aliased components in repetitive or single-shot events, set the
oscilloscope acquisition mode to average.
What is Nyquist frequency?
The Nyquist frequency is the highest frequency that any real-time digitizing oscilloscope can
acquire without aliasing. This frequency is half of the sample rate. Frequencies above the Nyquist
frequency will be under sampled, which causes aliasing. So, pay more attention to the relation
between the frequency being sampled and measured.
9.8 XY Mode
XY mode is used to display the amplitude of one waveform versus the amplitude of another. The
data point from the first waveform defines the horizontal position, while the corresponding data
point from the second waveform shows the vertical position for each point.
The oscilloscope is in the untriggered sampling mode: the data are displayed as bright points.
Operating the buttons :
When the HOR button is lit, the upper and lower buttons are used to adjust the horizontal scale
and position
If one of the channel buttons is lit, the vertical scaling and position are set with the upper and
lower buttons
The following functions are not available in the XY mode:
Reference or digital waveforms
Cursor
Trigger controll
FFT
Operating steps:
1. Click to call up the menu panel. Click the XY softkey on panel to switch to the state ON
2. To make the XY view full screen, select as in the bottom menu Full Screen ON
9.9 Pass/Fail
The function monitors changes of signals and output pass or fail signals by comparing Pass/Fail
the input signal that is within the pre-defined mask.
Click to call up the menu panel. Click the softkey on panel to switch to the ON state. P/F
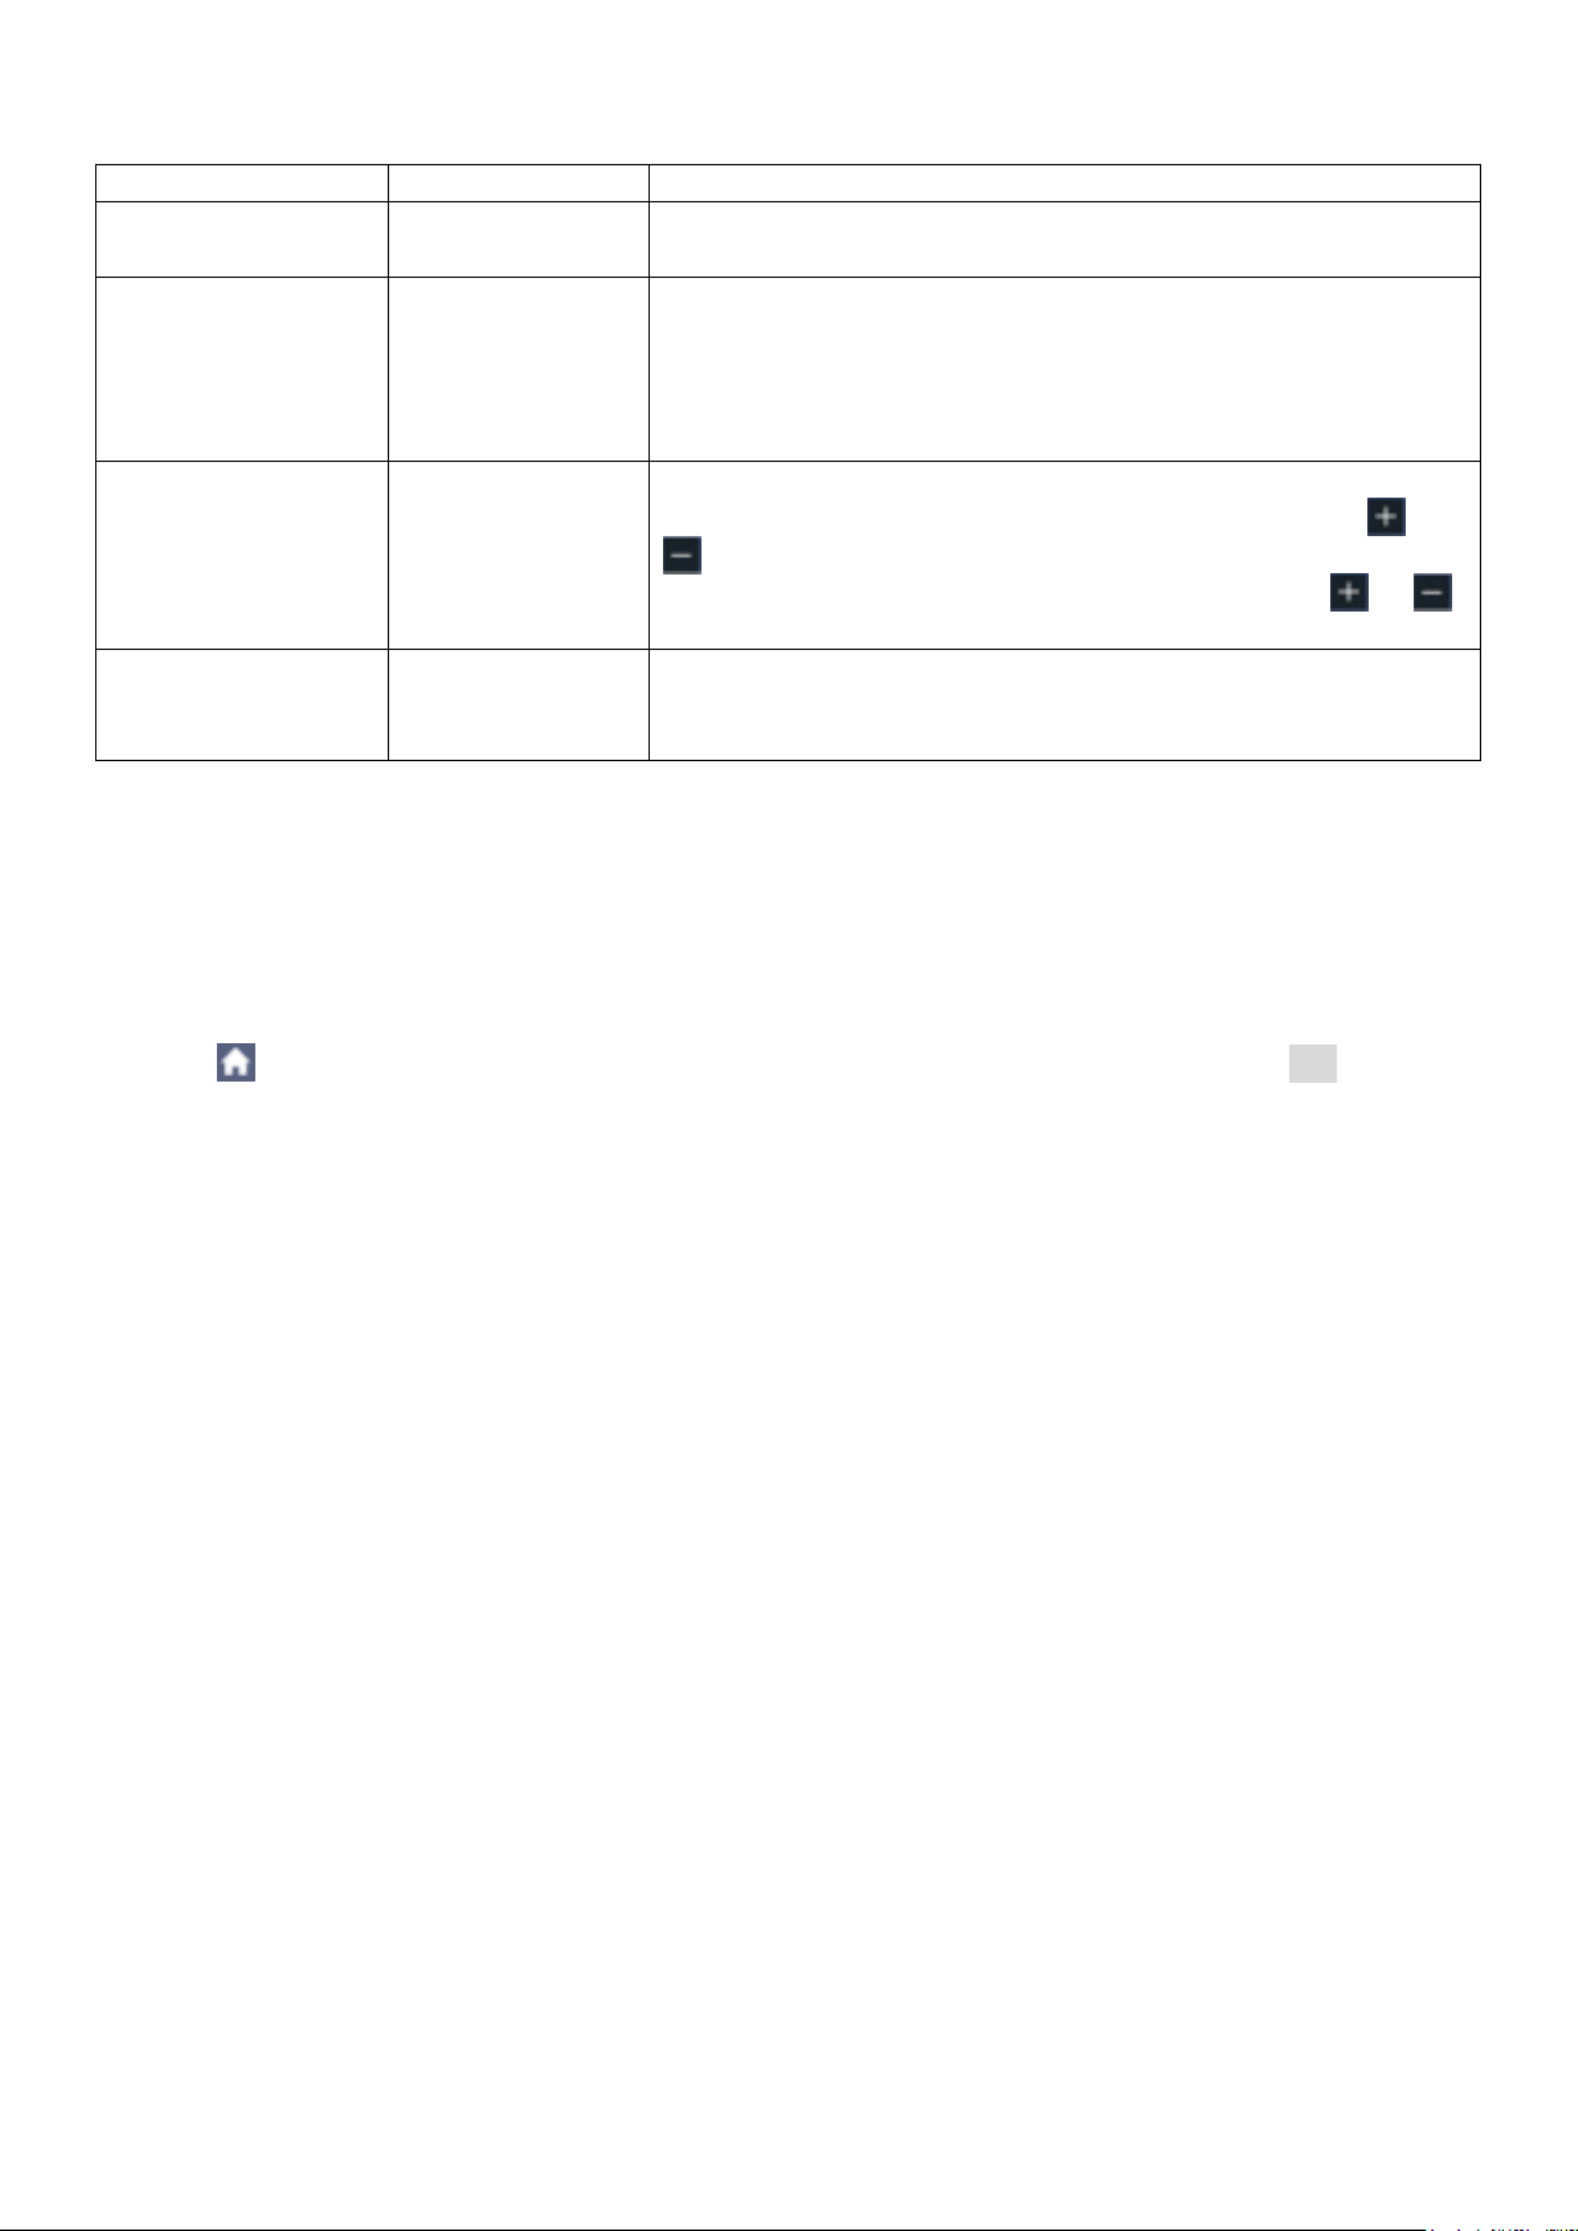
- - 72
The pass/Fail function:
Menu
Settings
Description
Operate
Start
Stop
Start operation
Stop operation
Output
Pass
Fail
Beep
Stop
Info
Signal tested corresponds with the rule
Signal tested not correspond with the rule
Beep when it satisfies the rule
Stop once satisfying the rule
Control the display status of info frame
Rule
Source
Horizontal
Vertical
Create
Select the source as CH1, CH2, CH3 or CH4
Change the Horizontal tolerance value by clicking or
Change the Vertical tolerance value by clicking or
Use the rule set as testing rule
Save rule
Number
Save
Load
Select any one from Rule1 - Rule8 as your rule name
Select to save the rule Save
Load some rule as the testing rule
Pass/Fail test:
Detect whether the input signal is within the limits of the rule, if it exceeds limits of the rule, it is "Fail";
otherwise it is "Pass". Also, it can output fail or pass signal by built-in and configurable output port.
To run the test, read the following steps:
1. Click to call up the menu panel. Click the oftkey on panel to switch to the state. P/F s ON
2. Create rule Rule Source Horizontal: Select in the bottom menu. Select in the right menu. Set
tolerance and Vertical tolerance in the right menu. Select in the right menu to create the Create
rule.
3. Set output type Output: Select in the bottom menu to enter output option setting. Choose any
one or two of the options " ", " " or " ". " " and " " are mutually exclusive Pass Fail Beep Pass Fail
options, which could not be chosen simultaneously. " " means stop once the condition Stop
satisfies your setting.
4. Begin to test: Operate Start Select in the bottom menu, switch it to , the test will begin.
5. Save rule: SaveRule Select in the bottom menu. Select the save location in the left menu, and
then select in the right menu to save the rules, which could be called up at once when Save
need. Select to call up the rule saved.Load
Note:
1. When Pass/Fail is ON, if XY or FFT is ready to run, then Pass/Fail will be closed; under the
mode of XY or FFT, Pass/Fail is unable.
2. Under the mode of Factory, Auto Scale and Auto Set, Pass/Fail will be closed.
3. When no save setting left in the rule save, tip will be given to show "NO RULE SAVED".
4. Under the status of stop, data comparing will stop, and when it goes on running, the number of
Pass/Fail will increase from the former number, not from zero.
5. When the waveform playback mode is on, Pass/Fail is used to test the played-back waveform
specially.

- - 73
10. Executive buttons
Executive buttons include Copy, Default, Run/Stop, Single and Autoset
Autoset
This button is used to automatically set all the control values of the device required for the
generation of a viewable waveform. Press the AUTOSET button; the oscilloscope then performs a
quick automatic measurement of the signal.
The following table shows the parameter values of the Autoset function:
Functions
Settings
Channel Coupling
DC
Vertical Scale
Adjust to the proper division.
Vertical Position
Adjust to the proper position.
Bandwidth
Full
Horizontal Level
Middle
Horizontal Sale
Adjust to the proper division
Trigger Type
Slope or Video
Trigger Source
The previous source before autoseting.
When the previous source has no input signal, the
source will be set to the minimum channel which
has input signal.
When all the channels have no input signal, the
source will be set to CH1.
Trigger Coupling
DC
Trigger Slope
Rising edge
Trigger Level
3/5 of the Vpk-pk
Trigger Mode
Auto
Display Format
YT
Force
Stop
Help
Exit
Pass/Fail
Off
Inverted
Off

- - 74
Zoom Mode
Exit
Record Length
If greater than 10M, it will be set to 10M
Waveform Math or
FFT
Off
Waveform Record
Off
Slow-scan
Off
Persist
Off
Note: When the autoscale is turned on and running, the Autoset button is invalid.
Description of the icons:
Cancel Autoset Go back to display the upper menu and waveform information. :
The Autoset function requires that the frequency of signal should be no lower than 20Hz, and the
amplitude should be no less than 5mv. Otherwise, the Autoset function may be invalid.
Run/Stop
Enable or disable sampling on input signals.
Notice: When there is no sampling at STOP state, the vertical division and the horizontal time
base of the waveform still can be adjusted within a certain range, in other words, the signal can be
expanded in the horizontal or vertical direction.
When the horizontal time base is ≤50ms, the horizontal time base can be expanded for 4 divisions
downwards.
Single
Push this button you can set the trigger mode as single directly, so when trigger occurs, acquire
one waveform then stop.
Copy
You can save the waveform by just pushing the panel button in any user interface. The Copy
source wave and the storage location are according to the settings of the function menu Save
when the Type is Wave
10.1 Print the screen image
Follow the steps to print an image of the oscilloscope screen:
1. Connect the printer to the port on the side panel of the oscilloscope. USB Device
Note: The USB Device port supports PictBridge compatible printers.
2. Click to call up the menu panel. Click the Utility softkey on pane select in the l, Function
bottom menu, select in the left menu. Output
3. In the bottom menu, select as . (When is selected, you can get an image by Device PICT PC
Oscilloscope software.)
4. In the bottom menu, select . In the right menu, set the print parameters. The Print Set On
selection of will print out a copy with a white background. Ink Saver
5. Once you have connected a printer to your oscilloscope and set up print parameters, click Play
in the bottom menu to print current screen images.
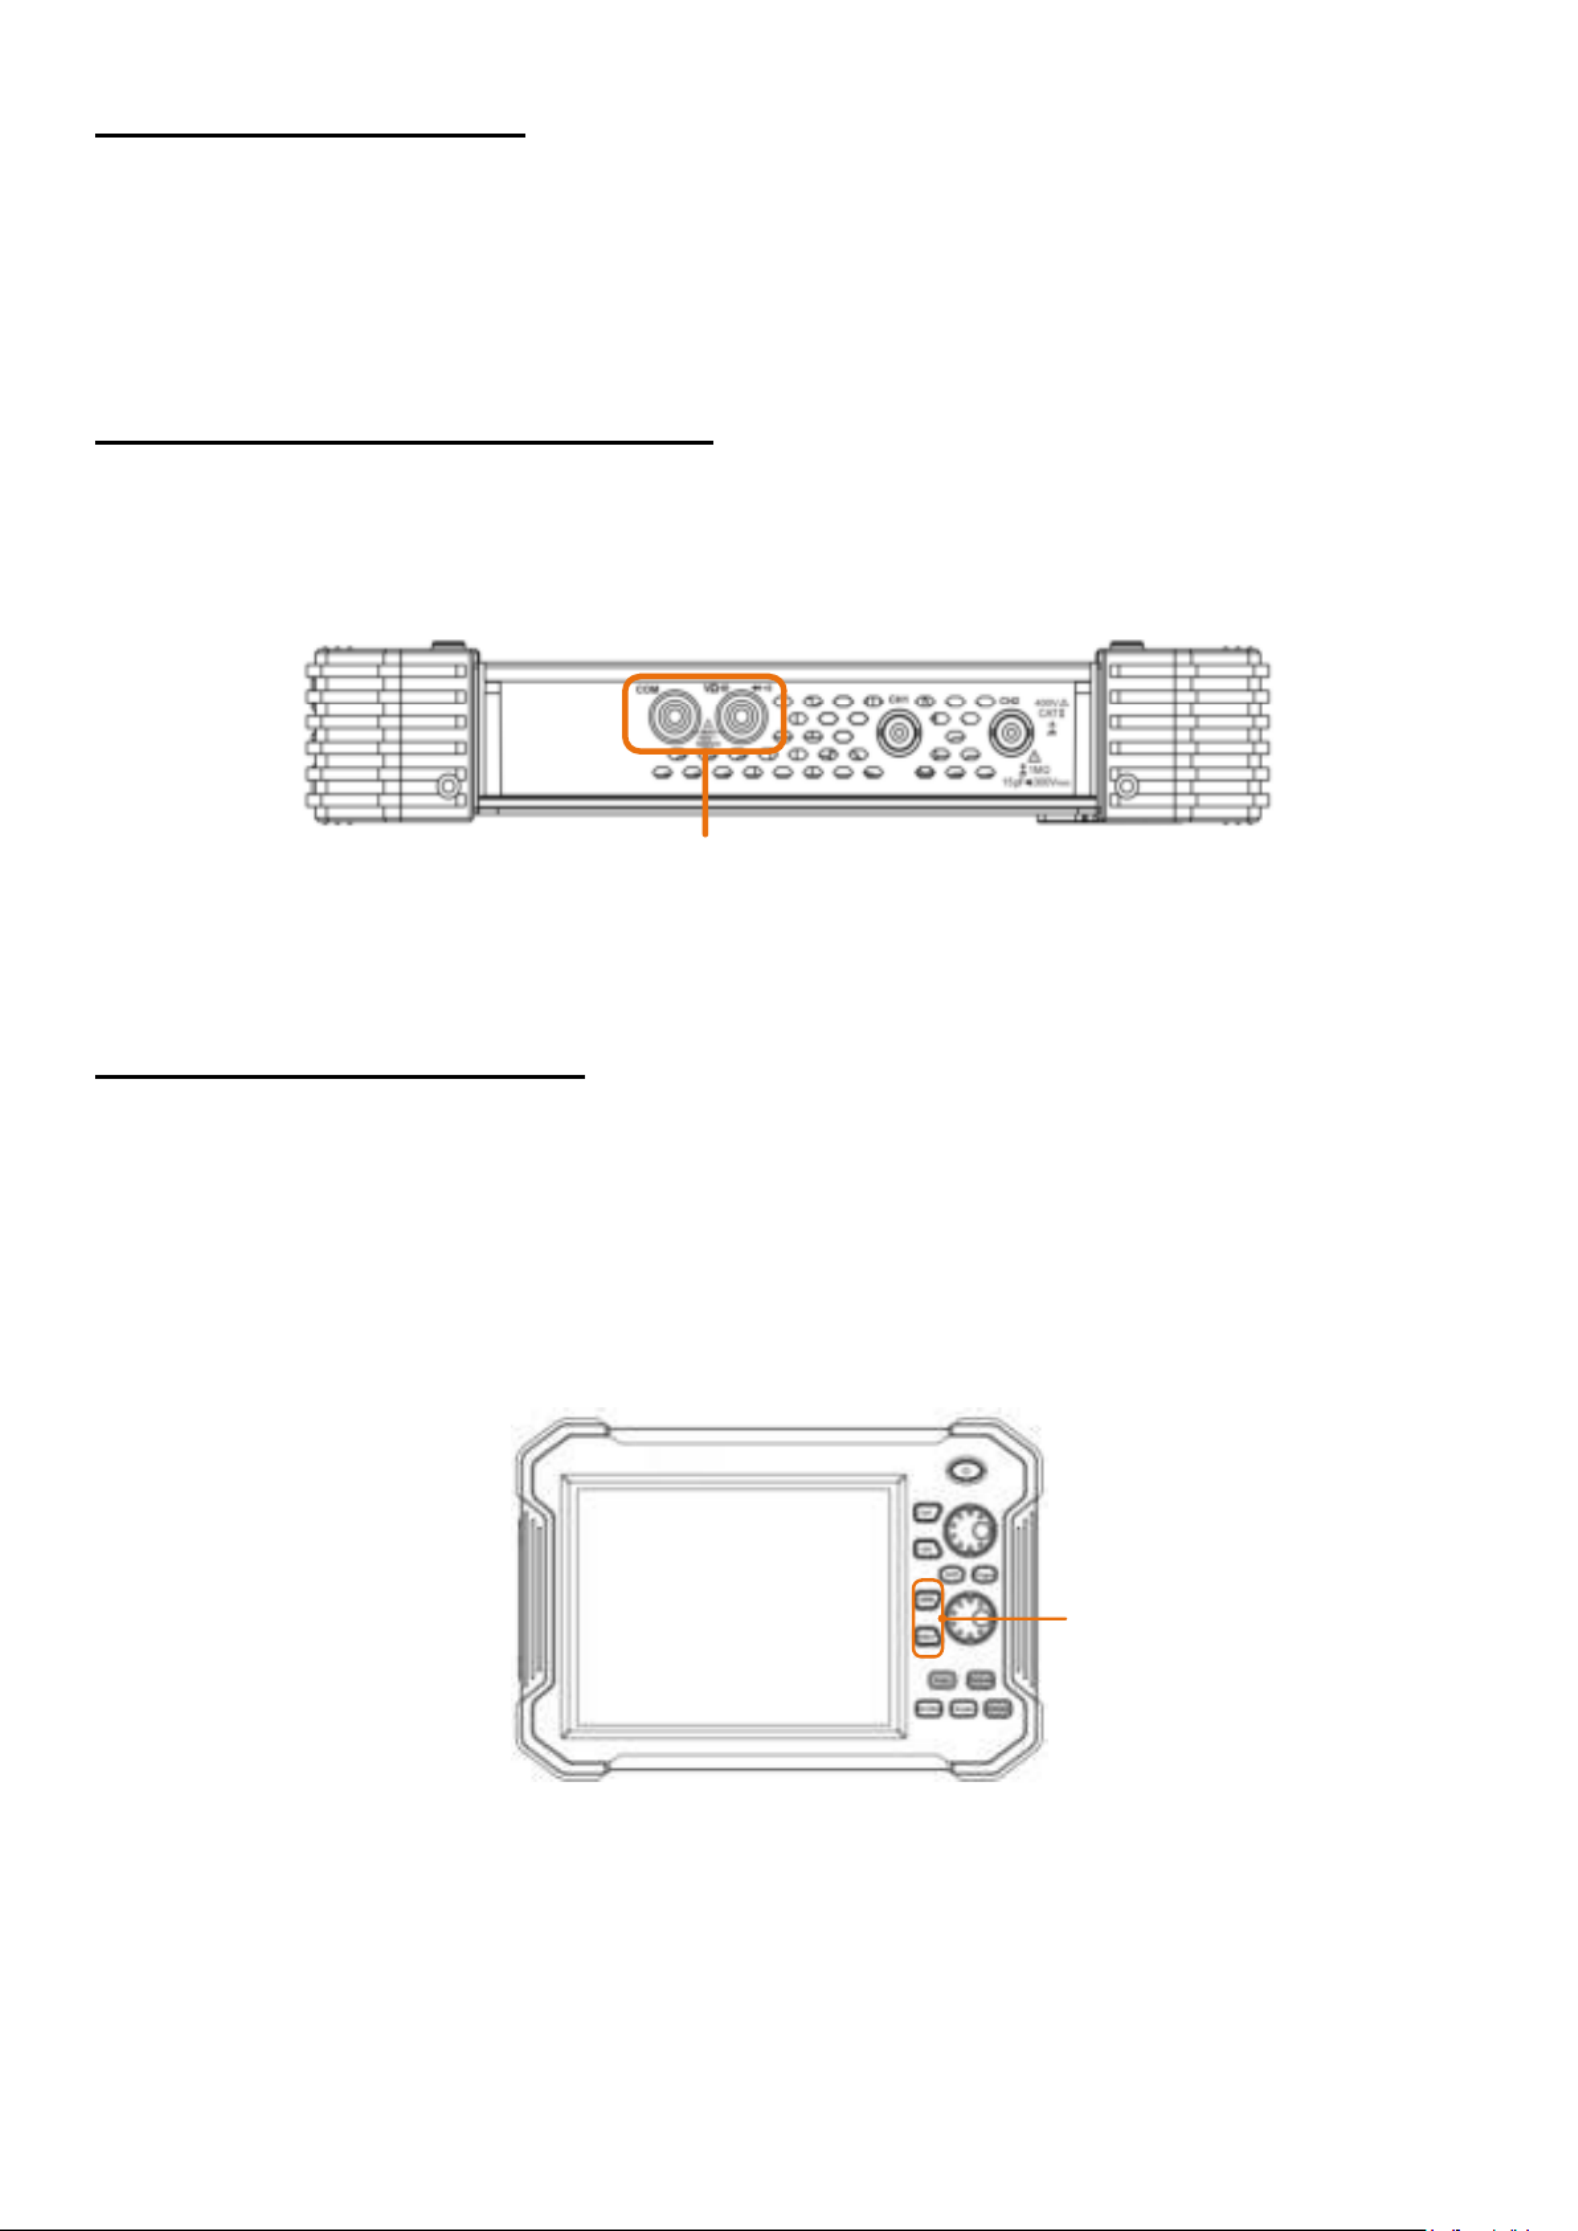
- - 75
Input connectors of multimeter
Multimeter
Button
11. Using the multimeter
The integrated multimeter can be switched on and off using the DMM button. The display window
appears in the upper right-hand side of the screen after the function has been activated. The
multimeter function is only available for the PeakTech 1206 and PeakTech 1207 oscilloscope
models.
11.1 Connections of the multimeter
The input terminals are on the top of the oscilloscope, which marked as COM, V/Ω/C.
Figure 5.1 Multimeter connection sockets
11.2 Menu of the multimeter
Press the DMM button on the front to access the multimeter function. The backlight of the button
lights up when the multimeter function is activated.
The measuring function is selected with the Select button. Switch between AC and DC when
measuring voltage or current. Furthermore, it is possible to choose between resistance
measurement, capacitance measurement, continuity test and diode test using the Select button.
Figure 5.2 Multimeter function buttons

- - 76
The multimeter menu is described in the following table:
Menu
Settings
Description
Current
ACA
DCA
Measuring AC current
Measuring DC current
Voltage
ACV
DCV
Measuring AC voltage
Measuring DC voltage
R
C
Resistance measurement
Diode test
Testing continuity
Capacitance measurement
Hold
ON
OFF
Freeze the display during measurement
Configure
Relative
Setzt den aktuellen Messwert auf null. Die
Messung ist der Differenzwert des
Referenzwertes zur aktuellen Messanzeige.
Show info
ON OFF
Show / Hide the information window
Auto range
Select auto range mode
Manual range
selection
Select manual range mode
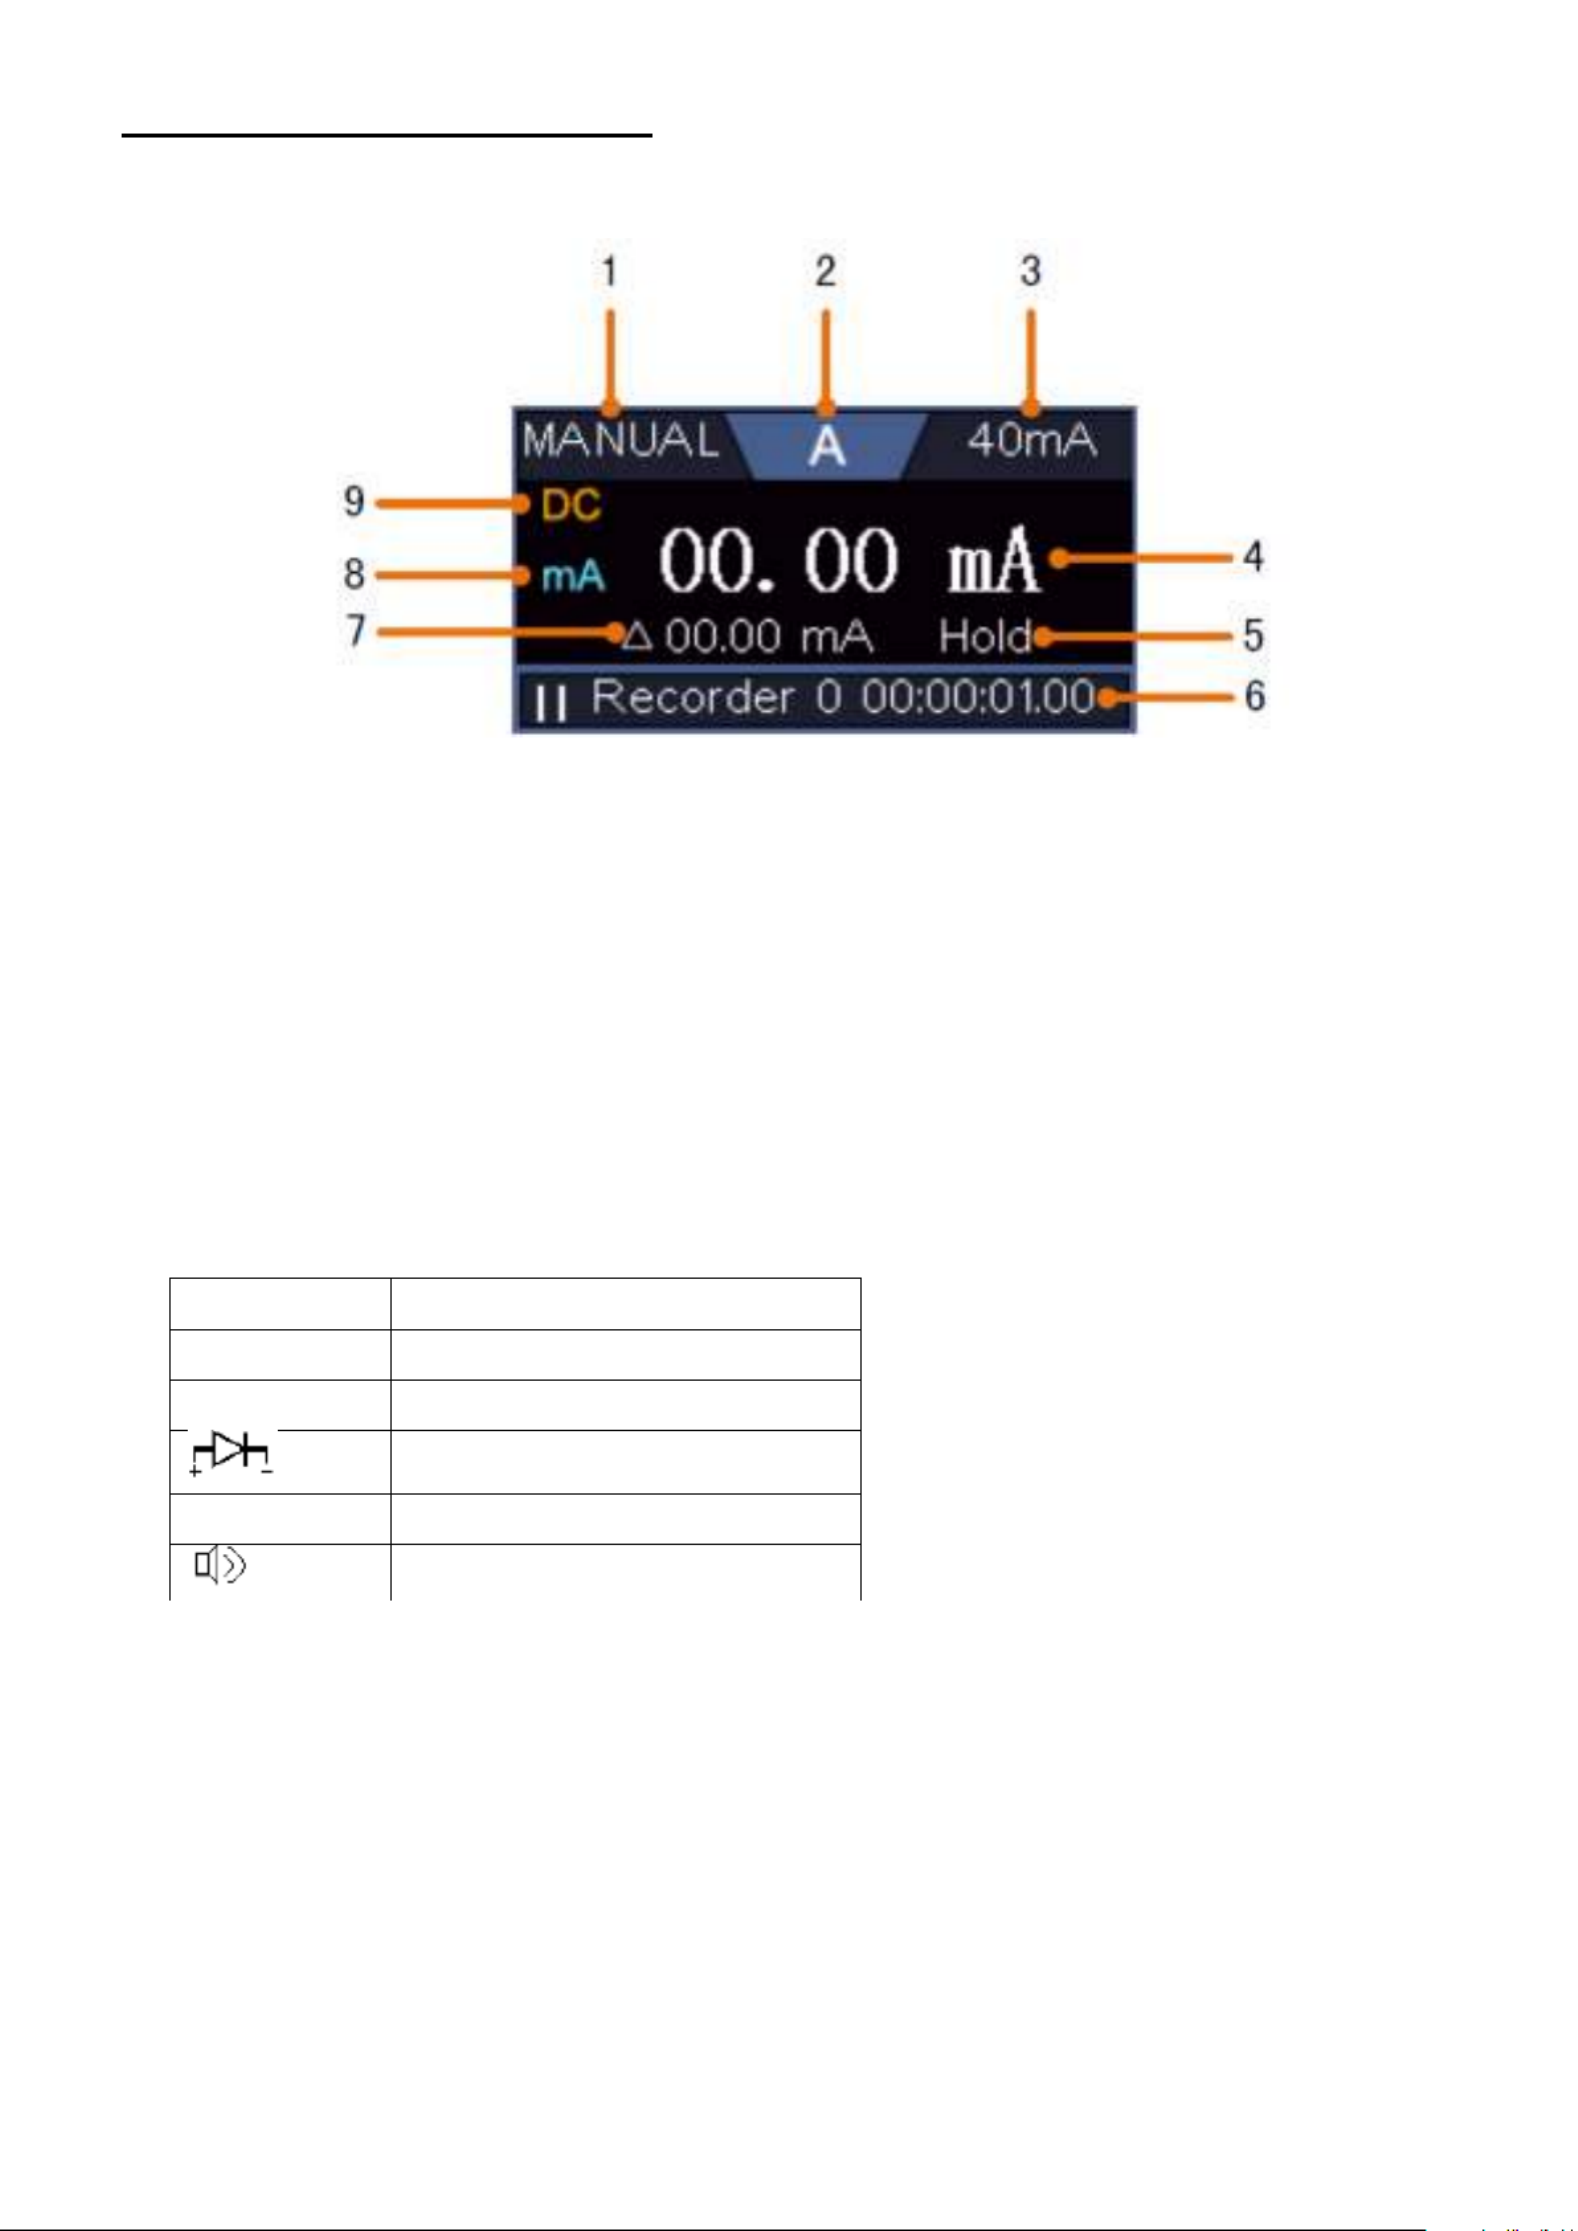
- - 77
11.3 DMM information window
The multimeter information window is displayed on the top right of the screen
Figure 5.3 Multimeter measurement screen
Description
1. Manual/Auto range indicators, MANUAL refers to the measuring range in manual operation
mode and AUTO refers to the measuring range in automatic operation mode.
2. Measurement mode indicators:
V
Voltage measurement
A
Current measurement
R
Resistance measurement
Diode measurement
C
Capacitance measurement
Continuity test
3. Current measuring range
4. Measured value with unit
5. Data-Hold activated
6. Multimeter recorder
7. Reference value oft he raltive measurement
8. Range of measuring current: mA or 10A
9. or DC when measuring current or voltage AC

- - 78
11.4 Measurements with the multimeter
11.4.1 AC/DC voltage measurement
1. Push button on the front panel. Select in the bottom menu, select it again to DMM Current
switch between (AC current) or (DC current). ACA DCA
2. Connect the black test lead to the COM terminal on the top of the oscilloscope and the red test
lead to the terminal. V/Ω/C
3. Probe the test points and read the display.
11.4.2 AC/DC current measurement
1. Push button on the front panel. Select in the bottom menu, select it again to DMM Current
switch between (AC current) or (DC current). ACA DCA
2. Insert the current ext module provided with the oscilloscope into the COM terminal and V/Ω/C
terminal on the top of the oscilloscope.
3. Connect the black test lead to the terminal on the top of the oscilloscope. Connect the COM
red test lead to the mA terminal.
4. Turn off the power of the measured circuit. Discharge all high- voltage capacitors.
5. connect the circuit path to be tested. Connect the black test lead to one side of the circuit Dis
(with a lower voltage); connect the red test lead to the other side (with a higher voltage).
Reversing the leads will produce a negative reading, but will not damage the multimeter.
6. Turn on the power of the measured circuit, and read the display.
7. Turn off the power of the measured circuit and discharge all high-voltage capacitors. Remove
the test leads and restore the circuit to the original condition.
11.4.3 sistance measurement Re
1. Press the DMM button on the front of the device. Then press R in the lower menu several
times to toggle between resistance, diode and capacitance until R is highlighted.
2. Connect the black test lead to the terminal on the top of the oscilloscope and the red test COM
lead to the terminal. V/Ω/C
3. Connect the test probes to the (voltage-free) electrical conductor to be measured and read
the measured value on the digital display of the multimeter window.
Note: Never carry out a resistance measurement on a live conductor to avoid damaging the
device.
Produkt Specifikationer
| Mærke: | PeakTech |
| Kategori: | Multimeter |
| Model: | 1211 |
Har du brug for hjælp?
Hvis du har brug for hjælp til PeakTech 1211 stil et spørgsmål nedenfor, og andre brugere vil svare dig
Multimeter PeakTech Manualer

2 September 2024
18 August 2024
18 August 2024
16 August 2024
16 August 2024
15 August 2024
15 August 2024
15 August 2024
15 August 2024
14 August 2024
Multimeter Manualer
- Multimeter Bosch
- Multimeter Hager
- Multimeter Owon
- Multimeter Extech
- Multimeter Silverline
- Multimeter Emos
- Multimeter Metrix
- Multimeter TFA
- Multimeter Pyle
- Multimeter Biltema
- Multimeter Abus
- Multimeter Keithley
- Multimeter Hama
- Multimeter Milwaukee
- Multimeter BENNING
- Multimeter Clas Ohlson
- Multimeter Metrel
- Multimeter Kyoritsu
- Multimeter Laserliner
- Multimeter Parkside
- Multimeter FERM
- Multimeter Stanley
- Multimeter Elro
- Multimeter REV
- Multimeter Elworks
- Multimeter Powerfix
- Multimeter Digitus
- Multimeter Alecto
- Multimeter Schneider
- Multimeter Basetech
- Multimeter Voltcraft
- Multimeter Testboy
- Multimeter Greenlee
- Multimeter Velleman
- Multimeter Somogyi
- Multimeter FLIR
- Multimeter Perel
- Multimeter JUNG
- Multimeter APPA
- Multimeter Amprobe
- Multimeter Fluke
- Multimeter Monacor
- Multimeter Brennenstuhl
- Multimeter Projecta
- Multimeter Maxwell
- Multimeter Testo
- Multimeter GW Instek
- Multimeter Brandson
- Multimeter Ideal
- Multimeter Multimetrix
- Multimeter Mastech
- Multimeter Högert
- Multimeter Brüder Mannesmann
- Multimeter Vimar
- Multimeter Klein Tools
- Multimeter Rigol
- Multimeter Uni-T
- Multimeter Joy-It
- Multimeter Wiha
- Multimeter HT Instruments
- Multimeter Chauvin Arnoux
- Multimeter Megger
- Multimeter Qian
- Multimeter Aim TTi
- Multimeter Steren
- Multimeter Gossen Metrawatt
- Multimeter Yato
- Multimeter Beha-Amprobe
- Multimeter Bearware
- Multimeter Sonel
- Multimeter Profile
- Multimeter Aldi
- Multimeter Amiko
- Multimeter Workzone
- Multimeter Tacklife
- Multimeter Etekcity
- Multimeter Digi-tool
- Multimeter Skandia
- Multimeter Elma
- Multimeter Hubinont
- Multimeter Kewtech
- Multimeter Strex
- Multimeter MBS
- Multimeter MGL Avionics
- Multimeter PCE Instruments
- Multimeter Micronta
- Multimeter CEM
- Multimeter Horex
- Multimeter Cosinus
- Multimeter Testec
- Multimeter Kurth Electronic
- Multimeter IWH
- Multimeter Weltron
- Multimeter Sanwa
- Multimeter Rohde & Schwarz
- Multimeter EEVBlog
- Multimeter Kingcraft
- Multimeter Weidmüller
- Multimeter Caltek
- Multimeter Noyafa
Nyeste Multimeter Manualer
9 April 2025
3 April 2025
3 April 2025
3 April 2025
3 April 2025
3 April 2025
3 April 2025
18 Marts 2025
14 Marts 2025
18 Februar 2025